Share to:


2018 Wigan Metropolitan Borough Council election

2018 Wigan Metropolitan Borough Council election

← 2016 3 May 2018 2019 →

25 of 75 seats to Wigan Metropolitan Borough Council
38 seats needed for a majority
  First party Second party
 
Leader Peter Smith Michael Winstanley
Party Labour Conservative
Leader since 1991 11 May 2016
Leader's seat Leigh West Orrell
Seats before 65 5
Seats won 60 7
Seat change Decrease 5 Increase 2

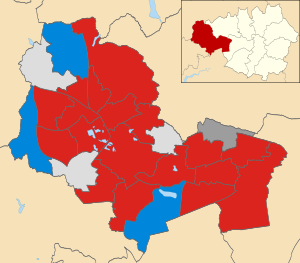
2018 local election results in Wigan
  Labour
  Independent

The 2018 Wigan Metropolitan Borough Council election took place on 3 May 2018 to elect members of Wigan Metropolitan Borough Council in England.[1] This was on the same day as other local elections.

Overview

Prior to the election, the composition of the council was:

After the election, the composition of the council was:

Number of Candidates fielded per party
Party Number of Candidates
Labour Party (UK) 25
Conservative Party (UK) 25
Liberal Democrats (UK) 14
Independents 11
UKIP 6
Green Party of England and Wales 3
Wigan Independents 3
Democrats and Veterans 1

Results summary

2018 Wigan Metropolitan Borough Council election
Party This election Full council This election
Seats Net Seats % Other Total Total % Votes Votes % +/−
  Labour 18 Decrease 5 72 42 60 80 32,512 52.3 Increase 1.2
  Conservative 3 Increase 2 12 4 7 9.3 14,980 24.1 Increase 7.5
  Independent 3 Increase 3 12 3 6 8 8,432 13.6 Increase 6.2
  Wigan Independents 1 Steady 4 1 2 2.7 2,109 3.4 Increase 0.1
  Liberal Democrats 0 Steady 0 0 0 0 2,343 3.8 Increase 2.8
  UKIP 0 Steady 0 0 0 0 1,196 1.9 Decrease 14.1
  Green 0 Steady 0 0 0 0 401 0.6 Decrease 0.2
  Democrats and Veterans 0 Steady 0 0 0 0 140 0.2 New

Results

Bolton West constituency

Atherton ward

Local Elections 2018: Atherton
Party Candidate Votes % ±%
Independent Stuart Andrew Gerrard 1,779 53.7 New
Labour Karen Aldred 1,197 36.2 Decrease 11.9
Conservative Marjorie Clayton 334 10.1 Decrease 2.0
Majority 582 17.5 N/A
Turnout 3,310 30.7 Increase 3.2
Independent gain from Labour Swing

Leigh constituency

Astley Mosley Common ward

Local Elections 2018: Astley Mosley Common
Party Candidate Votes % ±%
Labour Barry John Taylor 1,349 52.7 Decrease 14.9
Conservative Richard Alan Short 1,082 42.2 Increase 9.8
Liberal Democrats Stuart David Thomas 131 5.1 New
Majority 267 10.5 Decrease 24.7
Turnout 2,562 27.2 Decrease 1.7
Labour hold Swing

Atherleigh ward

Local Elections 2018: Atherleigh
Party Candidate Votes % ±%
Labour Debra Susan Ann Wailes 938 48.1 Decrease 1.4
Independent Anthony Thomas Waite 550 28.2 New
Conservative Paul Lambert Fairhurst 394 20.2 Increase 5.6
Liberal Democrats Lorraine Gillon 68 3.5 New
Majority 388 19.9 Increase 2.6
Turnout 1,950 23.4 Decrease 3.3
Labour hold Swing

Golborne and Lowton West ward

Local Elections 2018: Golborne and Lowton West
Party Candidate Votes % ±%
Labour Susan Gambles 1,280 57.2 Decrease 7.8
Independent William Kenneth Heaton 612 27.4 New
Conservative Gerard Joseph Houlton 345 15.4 Decrease 1.0
Majority 668 29.8 Decrease 16.6
Turnout 2,237 25.3 Decrease 1.7
Labour hold Swing

Leigh East ward

Local Elections 2018: Leigh East
Party Candidate Votes % ±%
Labour Frederick Brown Walker 1,189 59.6 Decrease 11.3
Conservative Denise Alison Young 518 26.0 Decrease 3.1
Liberal Democrats John Dowsett 288 14.4 New
Majority 671 33.6 Decrease 8.2
Turnout 1,995 22.2 Decrease 2.7
Labour hold Swing

Leigh South ward

Local Elections 2018: Leigh South
Party Candidate Votes % ±%
Labour Charles Rigby 1,531 54.4 Decrease 11.1
Conservative Connor Jack Short 1,283 45.6 Increase 11.1
Majority 248 8.8 Decrease 22.2
Turnout 2,814 27.5 Decrease 1.1
Labour hold Swing

Leigh West ward

Local Elections 2018: Leigh West
Party Candidate Votes % ±%
Labour Peter Richard Charles Smith 1,308 54.1 Decrease 21.2
Independent Jayson Michael Allan Lomax-Hargreaves 578 23.9 New
Conservative Richard Byrom Houlton 374 15.5 Decrease 9.2
Liberal Democrats Natalie Smalley 158 6.5 New
Majority 730 30.2 Decrease 20.4
Turnout 2,418 23.1 Decrease 1.8
Labour hold Swing

Lowton East ward

Local Elections 2018: Lowton East
Party Candidate Votes % ±%
Conservative Edward Noel Houlton 2,099 60.9 Increase 14.7
Labour Garry Peter Lloyd 1,346 39.1 Increase 6.4
Majority 753 21.8 Increase 8.3
Turnout 3,445 36.1 Increase 1.0
Conservative hold Swing

Tyldesley ward

Local Elections 2018: Tyldesley
Party Candidate Votes % ±%
Labour Joanne Marshall 1,344 51.0 Decrease 14.6
Independent Julian David Marsh 706 26.8 New
Conservative David John Stirzaker 587 22.3 Increase 2.5
Majority 638 24.2 Decrease 21.6
Turnout 2,637 25.5 Decrease 0.9
Labour hold Swing

Makerfield constituency

Abram ward

Local Elections 2018: Abram
Party Candidate Votes % ±%
Labour Carl Sweeney 1,479 68.7 Increase 11.3
Conservative Beverley Anne Bridgwater 404 18.8 Increase 12.3
UKIP Frank Thomas Swift 274 12.7 Decrease 14.9
Majority 1,075 49.9 Increase 20.1
Turnout 2,152 20.7 Decrease 4.0
Labour hold Swing

Ashton ward

Local Elections 2018: Ashton
Party Candidate Votes % ±%
Labour Anthony John Sykes 1,112 53.2 Increase 10.9
Independent Michael Moulding 793 37.9 New
UKIP Gillian Mary Gibson 109 5.2 Decrease 16.7
Liberal Democrats Geoffrey Stephen Matthews 41 2.0 New
Conservative Marie Winstanley 36 1.7 Decrease 4.6
Majority 319 15.3 Decrease 5.1
Turnout 2,091 23.5 Decrease 6.1
Labour hold Swing

Bryn ward

Local Elections 2018: Bryn
Party Candidate Votes % ±%
Independent Andrew Collinson 1,065 43.7 New
Labour Vicky Johnson 973 39.9 Decrease 0.3
Conservative Judith Anderson 198 8.1 Increase 3.7
UKIP Philip Hayden 133 5.5 Decrease 19.0
Liberal Democrats Denise Melling 67 2.8 Decrease 7.0
Majority 92 3.8 N/A
Turnout 2,436 27.6 Decrease 4.2
Independent gain from Labour Swing

Hindley ward

Local Elections 2018: Hindley
Party Candidate Votes % ±%
Labour Jim Talbot 1,063 45.9 Decrease 7.2
Independent Jim Ellis 905 39.0 New
Conservative Margaret Mary Winstanley 206 8.9 Decrease 0.9
Green Neil Hancox 86 3.7 New
Liberal Democrats John Charles Skipworth 58 2.5 New
Majority 158 6.9 Decrease 12.0
Turnout 2,318 24.1 Decrease 2.3
Labour hold Swing

Hindley Green ward

Local Elections 2018: Hindley Green
Party Candidate Votes % ±%
Independent Paul Anthony Maiden 976 41.4 New
Labour Gena Merrett 787 33.4 Decrease 10.5
Liberal Democrats John Thomason 305 13.0 New
Conservative Jonathan Charles Cartwright 287 12.2 Increase 3.1
Majority 189 8.0 N/A
Turnout 2,355 27.4 Decrease 2.3
Independent gain from Labour Swing

Orrell ward

Local Elections 2018: Orrell
Party Candidate Votes % ±%
Conservative Richard Clayton 1,430 46.6 Increase 14.0
Labour Eileen Winifred Rigby 1,273 41.5 Increase 6.6
Liberal Democrats Denise Margaret Capstick 367 12.0 New
Majority 157 5.1 N/A
Turnout 3,070 32.2 Decrease 1.0
Conservative gain from Labour Swing

Winstanley ward

Local Elections 2018: Winstanley
Party Candidate Votes % ±%
Labour Clive William Morgan 1,396 58.4 Increase 14.3
Conservative Daniel Andrew Whitehouse 509 21.3 Increase 11.5
Green Steven Charles Heyes 195 8.2 Increase 0.4
UKIP Daniel John Singleton 177 7.4 Decrease 25.3
Liberal Democrats Neil Duncan Stevenson 114 4.8 New
Majority 887 37.1 Increase 25.7
Turnout 2,391 26.2 Decrease 3.2
Labour hold Swing

Worsley Mesnes ward

Local Elections 2018: Worsley Mesnes
Party Candidate Votes % ±%
Labour Patricia Lynne Holland 1,449 66.5 Increase 6.1
UKIP Maureen McCoy 327 15.0 Decrease 16.7
Conservative Paul Chapman 314 14.4 Increase 6.5
Liberal Democrats Joshua Hindle 90 4.1 New
Majority 1122 51.5 Increase 22.8
Turnout 2,180 24.1 Decrease 4.1
Labour hold Swing

Wigan constituency

Aspull, New Springs and Whelley ward

Local Elections 2018: Aspull, New Springs and Whelley
Party Candidate Votes % ±%
Labour Ronald Josef Conway 1,708 61.4 Increase 15.4
Conservative Michael Colin Owens 764 27.5 Increase 16.1
Liberal Democrats Andrew Julian Lee Holland 308 11.1 New
Majority 944 33.9 Increase 12.0
Turnout 2,780 28.2 Decrease 5.0
Labour hold Swing

Douglas ward

Local Elections 2018: Douglas
Party Candidate Votes % ±%
Labour Shirley Ann Dewhurst 1,551 78.6 Increase 18.6
Conservative Margaret Atherton 422 21.4 Increase 13.0
Majority 1,129 57.2 Increase 28.7
Turnout 1,973 20.8 Decrease 4.1
Labour hold Swing

Ince ward

Local Elections 2018: Ince
Party Candidate Votes % ±%
Labour James Moodie 1,273 69.2 Increase 12.4
Independent James O'Neill 379 20.6 New
Conservative Yamini Gupta 188 10.2 Increase 4.8
Majority 894 48.6 Increase 26.4
Turnout 1,840 20.7 Decrease 5.4
Labour hold Swing

Pemberton ward

Local Elections 2018: Pemberton
Party Candidate Votes % ±%
Labour Paul Prescott 1,472 74.4 Increase 11.7
Conservative Susan Atherton 322 16.3 Increase 8.8
Liberal Democrats David John Burley 185 9.3 New
Majority 1,150 58.1 Increase 22.0
Turnout 1,979 20.6 Decrease 4.8
Labour hold Swing

Shevington with Lower Ground ward

Local Elections 2018: Shevington with Lower Ground
Party Candidate Votes % ±%
Shevington Independents Janet Brown 1,107 40.1 Increase 14.8
Labour Mike Crosby 1,045 37.9 Increase 4.6
Conservative Allan Atherton 487 17.7 Increase 6.5
Green Joseph Robert Rylance 120 4.3 Decrease 0.6
Majority 62 2.2 N/A
Turnout 2,759 29.6 Decrease 3.9
Shevington Independents gain from Labour Swing

"Shevington Independents" is a description used by candidates for the Wigan Independents.

Standish with Langtree ward

Local Elections 2018: Standish with Langtree
Party Candidate Votes % ±%
Conservative Adam James Marsh 1,200 36.8 Increase 17.4
Labour Debbie Parkinson 1,185 36.4 Increase 18.5
Standish Independents Debbie Fairhurst 872 26.8 Decrease 15.8
Majority 15 0.4 N/A
Turnout 3,257 33.3 Decrease 3.4
Conservative gain from Standish Independents Swing

"Standish Independents" is a description used by candidates for the Wigan Independents.

Wigan Central ward

Local Elections 2018: Wigan Central
Party Candidate Votes % ±%
Labour George Davies 1,518 55.5 Increase 3.7
Conservative Lewis David Evans 834 30.5 Increase 10.9
Liberal Democrats Caroline Waddicor 163 6.0 New
Wigan Independents Gareth William Fairhurst 130 4.8 New
Independent Tony Spencer 89 3.3 New
Majority 684 25.0 Increase 1.8
Turnout 2,734 29.5 Decrease 3.7
Labour hold Swing

Wigan West ward

Local Elections 2018: Wigan West
Party Candidate Votes % ±%
Labour Phyllis Mary Cullen 1,746 72.0 Increase 11.4
Conservative Jean Margaret Peet 363 15.0 Increase 9.6
UKIP Nathan Alan Ryding 176 7.3 Decrease 17.9
Democrats and Veterans Ronnie Clark 140 5.8 New
Majority 1,383 57.0 Increase 21.6
Turnout 2,425 25.4 Decrease 2.7
Labour hold Swing

References

  1. ^ "Elections: Local elections". wigan.gov.uk. Wigan Metropolitan Borough Council. Retrieved 23 April 2018.
Prefix: a b c d e f g h i j k l m n o p q r s t u v w x y z 0 1 2 3 4 5 6 7 8 9

Portal di Ensiklopedia Dunia

Kembali kehalaman sebelumnya