Share to:


Canterbury City Council elections

Canterbury City Council is the local authority for the City of Canterbury. The council is elected every four years.

Summary results

Year Conservative Labour Liberal Democrat UKIP Green
2023 8 18 9 0 4
2019 23 10 6 0
2017 30 4 3 2

Council elections

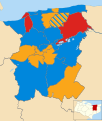
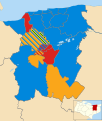
Result maps

By-election results

1995-1999

Swalecliffe By-Election 3 April 1997
Party Candidate Votes % ±%
Conservative Ian Thomas 564 35.1
Liberal Democrats 552 34.4
Labour 490 30.5
Majority 12 0.7
Turnout 1,606 51.0
Conservative gain from Liberal Democrats Swing
Gorrell By-Election 25 September 1997
Party Candidate Votes % ±%
Labour 577 44.1 −12.1
Conservative 567 43.3 +11.3
Liberal Democrats 151 11.5 −0.4
UKIP 14 1.1 +1.1
Majority 10 0.8
Turnout 1,309
Labour hold Swing
Marshside By-Election 25 September 1997
Party Candidate Votes % ±%
Labour 313 49.8 −13.2
Conservative 183 29.1 +2.0
Liberal Democrats 133 21.1 +13.8
Majority 130 20.7
Turnout 629
Labour hold Swing

1999-2003

Marshside By-Election 16 March 2000
Party Candidate Votes % ±%
Liberal Democrats Heather Lloyd 329 38.3 +21.6
Conservative Elizabeth Taylor 289 33.7 −0.6
Labour Alan Thomas 241 28.1 −21.0
Majority 40 4.6
Turnout 859 44.3
Liberal Democrats gain from Labour Swing
Herne By-Election 7 September 2000
Party Candidate Votes % ±%
Liberal Democrats Nigel Oakes 867 37.6 +5.2
Conservative Alan White 797 34.5 +9.0
Labour David Hornsby 344 14.9 −2.6
Green Carol Davis 187 8.1 −3.0
UKIP John Moore 112 4.9 +4.9
Majority 70 3.1
Turnout 2,307 26.8
Liberal Democrats hold Swing
Barton By-Election 7 June 2001
Party Candidate Votes % ±%
Conservative Michael Northey 1,184 35.4 −2.3
Liberal Democrats Valerie Ainscough 1,177 35.2 −11.6
Labour Theresa Mawson 824 24.6 +9.0
Green Steven Dawe 163 4.9 +4.9
Majority 7 0.2
Turnout 3,348 62.4
Conservative gain from Liberal Democrats Swing

2003-2007

North Nailbourne By-Election 22 January 2004
Party Candidate Votes % ±%
Conservative John Anderson 544 50.9 −5.3
Liberal Democrats Janet Horsley 478 44.7 +0.9
UKIP John Moore 26 2.4 +2.4
Labour Paul Todd 21 2.0 +2.0
Majority 66 6.2
Turnout 1,069 53.0
Conservative hold Swing
Barton By-Election 7 October 2004
Party Candidate Votes % ±%
Conservative Michael Northey 820 44.8 +10.4
Liberal Democrats James Flanagan 697 38.0 −4.3
Green Keith Bothwell 145 7.9 +0.9
Labour Laurence Ward 100 5.5 −5.1
Council Tax Payers Party James Cooper 70 3.8 −2.0
Majority 123 6.8
Turnout 1,832 31.8
Conservative gain from Liberal Democrats Swing
West Bay By-Election 5 May 2005
Party Candidate Votes % ±%
Conservative Vincent McMahan 1,177 37.6 −13.2
Liberal Democrats Kevin Sims 992 31.7 +13.5
Labour Brian Hunter 754 24.1 −6.9
UKIP John Moore 205 6.6 +6.6
Majority 185 5.9
Turnout 3,128 67.5
Conservative hold Swing
Sturry South By-Election 29 June 2006
Party Candidate Votes % ±%
Conservative Heather Taylor 474 52.4 −23.1
Liberal Democrats David Mummery 318 35.1 +23.3
Labour Andrew Fenyo 89 9.8 −2.8
Independent John Moore 24 2.6 +2.6
Majority 156 17.3
Turnout 905 41.3
Conservative hold Swing

2007-2011

Barton By-Election 10 July 2008[6]
Party Candidate Votes % ±%
Liberal Democrats Michael Steed 993 51.8 +9.3
Conservative Mark Evans 701 36.6 +2.7
Green Keith Bothwell 121 6.3 +6.3
Independent Blue Cooper 102 5.3 −0.7
Majority 292 15.2
Turnout 1,917 33.1
Liberal Democrats hold Swing

2011-2015

Blean Forest By-Election 20 September 2012[7]
Party Candidate Votes % ±%
Conservative Ben Fitter 342 44.2 −7.5
Labour Carol Goldstein 185 23.9 +23.9
Liberal Democrats Dan Smith 121 15.6 +0.4
Green Russell Page 64 8.3 −24.8
UKIP Howard Farmer 38 4.9 +4.9
Independent John Hippisley 24 3.1 +3.1
Majority 157 20.3
Turnout 774
Conservative hold Swing
Seasalter By-Election 2 May 2013[8]
Party Candidate Votes % ±%
Conservative Louise Morgan 789 38.4 −21.5
UKIP Howard Farmer 706 34.3 +34.3
Labour Rachel Goodwin 427 20.8 −6.7
Liberal Democrats Debra Enever 93 4.5 −8.1
TUSC Eriks Puce 41 2.0 +2.0
Majority 83 4.0
Turnout 2,056
Conservative hold Swing
Seasalter By-Election 19 September 2013[9]
Party Candidate Votes % ±%
UKIP Mike Bull 644 38.5 +38.5
Conservative Annette Stein 522 31.2 −28.7
Labour Rachel Goodwin 307 18.3 −9.2
Liberal Democrats Keith Hooker 147 8.8 −3.8
Green Russell Page 54 3.2 +3.2
Majority 122 7.3
Turnout 1,674
UKIP gain from Conservative Swing
Barham Downs By-Election 14 March 2014[10]
Party Candidate Votes % ±%
Liberal Democrats Michael Sole 337 37.3 −3.4
Conservative Stuart Walker 285 31.5 −11.4
UKIP Dave de Boick 164 18.1 +18.1
Labour David Wilson 78 8.6 +8.6
Green Pat Marsh 40 4.4 −12.0
Majority 52 5.8
Turnout 904
Liberal Democrats gain from Conservative Swing

2015-2019

Reculver By-Election 5 May 2016[11]
Party Candidate Votes % ±%
Conservative Ann Taylor 421 39.3 −31.7
UKIP Mick O'Brien 306 28.6 +28.6
Labour Simon Warley 251 23.4 −5.6
Liberal Democrats Ann Anderson 93 8.7 +8.7
Majority 115 10.7
Turnout 1,071
Conservative hold Swing
Westgate By-Election 8 June 2017[12]
Party Candidate Votes % ±%
Labour Simon Warley 1,761 43.4 +24.1
Liberal Democrats Daniel Prevett 978 24.1 +0.7
Conservative Luke Whiddett 929 22.9 −3.8
Green Henry Stanton 389 9.6 −9.8
Majority 783 19.3
Turnout 4,057
Labour gain from Conservative Swing

2019-2023

Chestfield By-Election 19 September 2019[13]
Party Candidate Votes % ±%
Conservative Ben Fitter-Harding 728 46.0 −6.5
Liberal Democrats Peter Old 562 35.5 +18.9
Labour Morag Warren 140 8.8 −6.9
Independent Joe Egerton 84 5.3 +5.3
Green Nicole David 68 4.3 −10.9
Majority 166 10.5
Turnout 1,582
Conservative hold Swing
Swalecliffe By-Election 6 May 2021[14]
Party Candidate Votes % ±%
Conservative Mark Dance 616 42.6 −3.7
Green Keith Bothwell 527 36.5 +20.6
Labour Craig Potter 278 19.2 −11.6
Independent Joe Egerton 24 1.7 +1.7
Majority 89 6.2
Turnout 1,445
Conservative hold Swing
Westgate By-Election 6 May 2021[15]
Party Candidate Votes % ±%
Labour Pip Hazelton 842 39.2 +5.4
Liberal Democrats Alex Lister 661 30.8 −6.5
Conservative Jake Warman 404 18.8 +9.2
Green Terry Thompson 242 11.3 +2.0
Majority 181 8.4
Turnout 2,149
Labour hold Swing
Gorrell By-Election 18 November 2021[16]
Party Candidate Votes % ±%
Green Clare Turnbull 1,149 43.9 +10.3
Labour Dane Buckman 803 30.7 −6.0
Conservative Stephen Spencer 608 23.2 +0.2
Workers Party Colin Gardner 58 2.2 +2.2
Majority 346 13.2
Turnout 2,618
Green gain from Labour Swing

References

  1. ^ The City of Canterbury (Electoral Arrangements) Order 1976
  2. ^ The Canterbury and Shepway (Areas) Order 1985
  3. ^ legislation.gov.uk - The Kent (District Boundaries) Order 1987. Retrieved on 6 November 2015.
  4. ^ legislation.gov.uk - The City of Canterbury (Electoral Changes) Order 2001. Retrieved on 4 October 2015.
  5. ^ "The Canterbury (Electoral Changes) Order 2014". legislation.gov.uk.
  6. ^ "Barton Ward By Election Results". Canterbury City Council. Archived from the original on 23 December 2012. Retrieved 20 July 2008.
  7. ^ "Local Elections Archive Project — Blean Forest Ward". www.andrewteale.me.uk. Retrieved 27 December 2022.
  8. ^ "Local Elections Archive Project — Seasalter Ward". www.andrewteale.me.uk. Retrieved 27 December 2022.
  9. ^ "Local Elections Archive Project — Seasalter Ward". www.andrewteale.me.uk. Retrieved 27 December 2022.
  10. ^ "Local Elections Archive Project — Barham Downs Ward". www.andrewteale.me.uk. Retrieved 27 December 2022.
  11. ^ "Local Elections Archive Project — Reculver Ward". www.andrewteale.me.uk. Retrieved 27 December 2022.
  12. ^ "Local Elections Archive Project — Westgate Ward". www.andrewteale.me.uk. Retrieved 27 December 2022.
  13. ^ "Local Elections Archive Project — Chestfield Ward". www.andrewteale.me.uk. Retrieved 27 December 2022.
  14. ^ "Local Elections Archive Project — Swalecliffe Ward". www.andrewteale.me.uk. Retrieved 27 December 2022.
  15. ^ "Local Elections Archive Project — Westgate Ward". www.andrewteale.me.uk. Retrieved 27 December 2022.
  16. ^ "Local Elections Archive Project — Gorrell Ward". www.andrewteale.me.uk. Retrieved 27 December 2022.
Prefix: a b c d e f g h i j k l m n o p q r s t u v w x y z 0 1 2 3 4 5 6 7 8 9

Portal di Ensiklopedia Dunia

Kembali kehalaman sebelumnya