Demographics of Toronto neighbourhoods
This article's
factual accuracy may be compromised due to out-of-date information.
Please help update this article to reflect recent events or newly available information. (April 2013 )
The list of demographic data on each Toronto neighbourhood is taken from the 2006 Canadian census.
Table
Neighbourhood boundaries are approximated to the nearest census tract . The colours indicate the former municipality (FM):
East York
Name
FM
Census Tracts
Population
Land area (km2)
Density (people/km2)
% Change in Population since 2001
Average Income
Transit Commuting %
% Renters
Second most common language (after English) by name
Second most common language (after English) by percentage
Map
Crescent Town
EY
0190.01
8,157
0.4
20,393
-10.0
23,021
24.5
20.3
Bengali (18.1%)
18.1% Bengali
Governor's Bridge /Bennington Heights
EY
0186.00
2,112
1.87
1129
4.0
129,904
7.1
13.3
Polish (1.4%)
01.4% Polish
Leaside
EY
0195.00, 0196.00
13,876
2.81
4938
3.0
82,670
9.7
10.5
Bulgarian (0.4%)
00.4% Bulgarian
O'Connor–Parkview
EY
0189.00, 0190.02, 0191.00, 0192.00, 0193.00
17,740
4.94
3591
-6.1
33,517
15.8
19.4
Urdu (3.2%)
03.2% Urdu
Old East York
EY
0180.00, 0181.01, 0181.02, 0182.00, 0183.00, 0184.01, 0184.02, 0185.01, 0185.02, 0187.00, 0188.00
52,220
7.94
6577
-4.6
33,172
22.0
19.1
Greek (4.3%)
04.3% Greek
Thorncliffe Park
EY
0194.01, 0194.02, 0194.03, 0194.04
17,949
3.09
5809
9.1
25,340
16.7
32.5
Urdu (21.5%)
21.5% Urdu
Name
FM
Census Tracts
Population
Land area (km2)
Density (people/km2)
% Change in Population since 2001
Average Income
Transit Commuting %
% Renters
Second most common language (after English) by name
Second most common language (after English) by percentage
Map
Alderwood
E
0211.00, 0212.00
11,656
4.94
2360
-4.0
35,239
8.8
8.5
Polish (6.2%)
06.2% Polish
Centennial
E
0236.01, 0236.02
12,565
4.94
2544
0.5
34,867
11.5
8.8
Polish (2.7%)
02.7% Polish
Clairville
E
0248.03, 0249.03
8,506
6.71
1268
-3.3
26,610
13.2
7.2
Punjabi (12.0%)
12.0% Punjabi
Eatonville
E
0213.00, 0221.02, 0222.01, 0222.02
19,131
11.26
1699
4.3
36,206
12.6
13.4
Serbian (3.2%)
03.2% Serbian
Humber Bay Shores
E
0200.00, 0201.00
10,775
1.42
7588
-5.7
39,186
15.7
31.6
Russian (5.2%)
05.2% Russian
Humber Heights
E
0241.00, 0242.00
4,674
1.69
2766
8.3
39,738
10.1
9.7
Spanish (4.1%)
04.1% Spanish
Humberwood
E
0247.01
7,319
17.4
421
8.0
29,576
7.9
7.0
Punjabi (26.7%)
26.7% Punjabi
Humber Valley Village
E
0230.01, 0230.02. 0231.00
14,453
5.45
2652
-0.1
80,618
12.0
17.8
Ukrainian (3.9%)
03.9% Ukrainian
Islington – Six Points
E
0223.00, 0224.00, 0225.01, 0225.02
16,508
4.02
4106
3.7
43,570
17.1
22.2
Korean (4.9%)
04.9% Korean
Kingsview Village
E
0239.00, 0243.01, 0243.02
16,254
4.05
4013
-6.2
32,004
11.8
14.6
Somali (7.0%)
07.0% Somali
Long Branch
E
0206.01, 0206.02
9,625
2.22
4336
-7.4
37,288
14.2
23.0
Polish (4.5%)
04.5% Polish
Markland Wood
E
0220.00, 0221.01
10,240
2.92
3507
1.0
51,695
9.2
9.7
Polish (3.4%)
03.4% Polish
Mimico
E
0202.00, 0203.00, 0209.00, 0210.00
14,198
5.4
2629
15.4
47,011
11.6
15.5
Polish (3.6%)
03.6% Polish
New Toronto
E
0204.00, 0207.00, 0208.00
10,455
2.71
3858
-5.8
33,415
13.0
25.6
Polish (4.6%)
04.6% Polish
Princess Gardens
E
0232.00, 0233.00
9,288
4.13
2249
1.0
80,607
7.2
5.8
Korean (2.4%)
02.4% Korean
North York
Name
FM
Census Tracts
Population
Land area (km2)
Density (people/km2)
% Change in Population since 2001
Average Income
Transit Commuting %
% Renters
Second most common language (after English) by name
Second most common language (after English) by percentage
Map
Old Toronto
Name
FM
Census Tracts
Population
Land area (km2)
Density (people/km2)
% Change in Population since 2001
Average Income
Transit Commuting %
% Renters
Second most common language (after English) by name
Second most common language (after English) by percentage
Map
Scarborough
Name
FM
Census Tracts
Population
Land area (km2)
Density (people/km2)
% Change in Population since 2001
Average Income
Transit Commuting %
% Renters
Second most common language (after English) by name
Second most common language (after English) by percentage
Map
Toronto CMA Average
All
5,113,149
5903.63
866
9.0
40,704
10.6
11.4
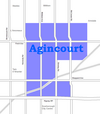
Agincourt
S
0377.01, 0377.02, 0377.03, 0377.04, 0378.02, 0378.08, 0378.14, 0378.23, 0378.24
44,577
12.45
3580
4.6
25,750
11.1
5.9
Cantonese (19.3%)
19.3% Cantonese
Alexandra Park
OCoT
0039.00
4,355
0.32
13,609
0.0
19,687
13.8
28.0
Cantonese (17.9%)
17.9% Cantonese
Allenby
OCoT
0140.00
2,513
0.58
4333
-1.0
245,592
5.2
3.4
Russian (1.4%)
01.4% Russian
Amesbury
NY
0280.00, 0281.01, 0281.02
17,318
3.51
4,934
1.1
27,546
16.4
19.7
Spanish (6.1%)
06.1% Spanish
Armour Heights
NY
0298.00
4,384
2.29
1914
2.0
116,651
10.8
16.1
Russian (9.4%)
09.4% Russian
Banbury
NY
0267.00
6,641
2.72
2442
5.0
92,319
6.1
4.8
Unspecified Chinese (5.1%)
05.1% Unspecified Chinese
Bathurst Manor
NY
0297.01, 0310.01, 0310.02
14,945
4.69
3187
12.3
34,169
13.4
18.6
Russian (9.5%)
09.5% Russian
Bay Street Corridor
OCoT
0062.01
4,787
0.11
43,518
3.0
40,598
17.1
49.3
Mandarin (9.6%)
09.6% Mandarin
Bayview Village
NY
0305.01, 305.02
12,280
4.14
2,966
41.6
46,752
14.4
15.6
Cantonese (8.4%)
08.4% Cantonese
Bayview Woods – Steeles
NY
0323.01, 0323.02, 0324.01
13,298
4.07
3267
-1.5
41,485
11.2
13.9
Cantonese (9.3%)
09.3% Cantonese
Bedford Park
OCoT
0141.01, 0141.02, 0142.00
13,749
2.27
6057
-1.4
80,827
15.2
10.1
Greek (0.7%)
00.7% Greek
Bendale
S
0353.02, 0354.00, 0367.02, 0368.00, 0369.00
28,945
8.49
3409
12.9
29,723
13.0
10.4
Tamil (3.7%)
03.7% Tamil
Birch Cliff
S
0338.00, 0339.00
12,266
3.48
3525
-3.0
48,965
11.4
15.2
Unspecified Chinese (0.9%)
00.9% Unspecified Chinese
Bloor West Village
OCoT
0104.00
5,175
0.74
6993
-2.0
55,578
20.7
8.3
Ukrainian (3.6%)
03.6% Ukrainian
Bracondale Hill
OCoT
0114.00
5,343
0.62
8618
-3.0
41,605
18.2
24.2
Greek (4.8%)
04.8% Greek
Branson
NY
0309.00, 0317.05
8,017
1.25
6414
-3.8
27,156
18.0
27.2
Russian (24.1%)
24.1% Russian
Bridle Path
NY
0264.00
1,540
3.46
445
11.0
314,107
7.1
2.3
Cantonese (12.0%)
12.0% Cantonese
Brockton
OCoT
0046.00, 0053.00
9,039
1.1
8217
-9.5
27,260
22.3
17.3
Portuguese (19.9%)
19.9% Portuguese
Cabbagetown
OCoT
0066.00, 0067.00, 0068.00
11,120
1.4
7943
5.3
50,398
18.5
29.6
Unspecified Chinese (1.6%)
01.6% Unspecified Chinese
Caribou Park
NY
0277.00
4,097
1.02
4017
-2.0
103,703
8.4
7.6
Tagalog (2.9%)
02.9% Tagalog
Carleton Village
OCoT
0108.00
6,544
0.74
8843
-4.0
23,301
19.0
19.9
Portuguese (17.0%)
17.0% Portuguese
Casa Loma
OCoT
0118.00
3,597
0.67
5369
23.0
82,203
18.1
32.9
Korean (1.8%)
01.8% Korean
Chaplin Estates
OCoT
0129.00
4,906
0.93
5275
1.0
81,288
22.7
24.5
French (1.2%)
01.2% French
Christie Pits
OCoT
0094.00
5,124
0.64
8006
-5.0
30,556
18.8
15.3
Portuguese (11.9%)
11.9% Portuguese
Church and Wellesley
OCoT
0063.01, 0063.02
13,397
0.55
24,358
8.8
37,653
25.1
57.0
Spanish (1.8%)
01.8% Spanish
Clairlea
S
0340.00, 0348.00
11,104
3.58
3102
1.8
33,392
18.1
12.7
Filipino (4.3%)
04.3% Filipino
Cliffcrest
S
0333.00, 0334.00, 0335.00
14,531
7.01
2073
-2.9
38,182
12.5
12.2
Tamil (1.5%)
01.5% Tamil
Cliffside
S
0336.00, 0337.00
9,386
2.45
3831
-6.3
32,701
14.8
11.4
Cantonese (2.3%)
02.3% Cantonese
Corktown
OCoT
0016.00
4,484
0.67
6693
77.0
54,681
15.5
17.6
Spanish (2.1%)
02.1% Spanish
Cricket Club
NY
0275.00
5,504
1.96
2808
3.0
104,362
8.7
15.4
Filipino (1.4%)
01.4% Filipino
Davenport
OCoT
0109.00, 0115.00
8,781
0.99
8870
-6.9
28,335
19.8
18.2
Portuguese (17.1%)
17.1% Portuguese
Davisville
OCoT
0126.00, 0127.00, 0128.02, 0128.03, 0128.04
23,727
3.14
7556
4.5
55,735
26.0
31.7
Persian (1.5%)
01.5% Persian
Deer Park
OCoT
0121.00, 0122.00, 0123.00, 0124.00
15,165
1.46
10,387
5.2
80,704
26.4
41.3
Russian (1.1%)
01.1% Russian
Discovery District
OCoT
0035.00
7,262
0.66
6998
8.0
41,998
12.7
32.1
Unspecified Chinese (6.5%)
06.5% Unspecified Chinese
Distillery District /West Don Lands
OCoT
0017.00
6,378
1.33
4795
-1.0
40,617
19.5
37.5
French (2.5%)
02.5% French
Don Mills
NY
0263.02, 0263.03, 0263.04, 0268.00, 0269.02
21,372
8.99
2377
11.9
47,515
10.8
18.6
Unspecified Chinese (3.9%)
03.9% Unspecified Chinese
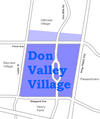
Don Valley Village
NY
0303.00, 0304.01, 0304.02, 0304.03, 0304.04, 0304.05, 0304.06
29,740
5.16
5764
-1.3
30,442
17.1
16.6
Unspecified Chinese (9.7%)
09.7% Unspecified Chinese
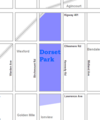
Dorset Park
S
0352.00, 0370.02, 0370.03
14,189
4.26
3331
7.8
26,525
15.2
9.6
Tamil (9.5%)
09.5% Tamil
Dovercourt Park
OCoT
0095.00, 0096.00
8,497
0.87
9767
-9.2
28,311
21.9
15.1
Portuguese (13.1%)
13.1% Portuguese
Downsview
NY
0289.00, 0290.00, 0291.01, 0291.02, 0292.00, 0294.01, 0294.02, 0295.00, 0296.00
36,613
16.13
2270
-5.0
26,751
14.4
18.3
Italian (11.7%)
11.7% Italian
Dufferin Grove
OCoT
0045.00, 0054.00
9,875
0.99
9975
-7.1
27,961
23.8
28.4
Portuguese (15.2%)
15.2% Portuguese
Earlscourt
OCoT
0107.00, 0110.00, 0111.00, 0112.00
17,240
2.24
7696
-1.7
26,672
17.7
8.5
Portuguese (18.9%)
18.9% Portuguese
East Danforth
OCoT
0075.00, 0076.00, 0080.01, 0080.02, 0081.00, 0082.00
21,440
2.5
8576
-6.3
33,847
24.2
18.3
Cantonese (4.2%)
04.2% Cantonese
Eglinton East
S
0353.03, 0353.04, 0355.02, 0355.03, 0355.04
22,387
3.23
6931
-1.0
25,307
19.4
19.1
Tamil (9.7%)
09.7% Tamil
Elia (Jane and Finch )
NY
0312.02, 0312.03, 0312.04, 0312.05, 0312.06, 0312.07, 0316.01, 0316.03, 0316.04, 0316.05, 316.06
48,003
7.66
6267
-10.0
22,691
13.0
18.8
Vietnamese (6.9%)
06.9% Vietnamese
Fashion District
OCoT
0011.00
4,642
0.98
4737
123.0
63,282
15.5
26.2
Portuguese (1.1%)
01.1% Portuguese
Financial District
OCoT
0014.00
548
0.47
1166
6.0
63,952
18.2
17.3
Japanese (1.8%)
01.8% Japanese
Flemingdon Park
NY
0260.01, 0260.03, 0260.04, 0260.05
21,287
2.43
8760
-6.0
23,471
16.6
19.6
Urdu (6.3%)
06.3% Urdu
Forest Hill
OCoT
0130.00, 0131.00, 0132.00, 0133.00, 0134.00
24,056
4.35
5530
-0.2
101,631
14.8
21.9
Russian (2.4%)
02.4% Russian
Fort York /Liberty Village
OCoT
0008.00
3,821
2.13
1794
126.0
46,086
22.8
27.9
Hindi (1.7%)
01.7% Hindi
Garden District
OCoT
0034.00
8,240
0.52
15,846
17.0
37,614
17.0
35.5
Unspecified Chinese (3.0%)
03.0% Unspecified Chinese
Glen Park
NY
0278.00, 0279.01, 0279.02
18,426
4.13
4462
4.4
35,022
13.6
17.0
Italian (9.3%)
09.3% Italian
Grange Park
OCoT
0036.00, 0037.00
9,007
0.84
10,793
-1.0
35,277
13.3
35.6
Unspecified Chinese (14.8%)
14.8% Unspecified Chinese
Graydon Hall
NY
0269.01
4,714
0.71
6639
-15.0
23,350
15.6
35.2
Persian (11.8%)
11.8% Persian
Guildwood
S
0330.00, 0331.01, 0331.04
12,820
4.77
2688
-2.0
40,806
11.6
8.0
Persian (1.2%)
01.2% Persian
Harbord Village
OCoT
0059.00, 0060.00
5,906
0.64
9,228
2.4
45,792
16.8
24.0
Portuguese (4.1%)
04.1% Portuguese
Harbourfront / CityPlace
OCoT
0012.00, 0013.00
14,368
1.87
9228
94.3
69,232
16.0
31.3
Unspecified Chinese (2.4%)
02.4% Unspecified Chinese
Harwood
Y
0155.00
3,375
0.78
4327
0.0
22,136
12.3
17.8
Portuguese (19.0%)
19.0% Portuguese
Henry Farm
NY
0301.01
2,790
0.91
3066
-6.0
56,395
15.6
15.9
Mandarin (3.9%)
03.9% Mandarin
High Park North
OCoT
0099.00, 0100.00, 0102.01, 0102.02, 0102.03, 0103.00
22,746
2.18
10,434
-1.6
46,437
27.5
32.8
Polish (3.0%)
03.0% Polish
Highland Creek
S
0362.02, 0362.03
12,853
5.13
2505
-0.1
33,640
9.7
1.8
Tamil (5.1%)
05.1% Tamil
Hillcrest
NY
0324.02, 0324.03, 0324.05, 0324.06
18,327
5.35
3426
-0.4
33,465
12.0
8.0
Unspecified Chinese (13.9%)
13.9% Unspecified Chinese
Hoggs Hollow
NY
0266.00
3,123
2.76
1132
2.0
222,560
4.3
2.9
Unspecified Chinese (2.4%)
02.4% Unspecified Chinese
Humber Summit
NY
0315.01, 0315.02, 0315.03
12,766
7.89
1618
2.1
26,117
7.3
7.6
Italian (15.1%)
15.1% Italian
Humberlea
NY
0293.00
4,327
2.0
2164
-2.0
30,907
8.7
7.9
Italian (11.1%)
11.1% Italian
Humbermede
NY
0313.00, 0314.01, 0314.02
14,778
4.35
3397
1.1
24,297
11.8
14.6
Punjabi (9.7%)
09.7% Punjabi
Humewood–Cedarvale
Y
0164.00, 0165.00, 0166.00, 0167.01, 0167.02, 0168.00
27,515
3.19
8624
-7.8
40,404
24.2
26.0
Spanish (3.6%)
03.6% Spanish
Ionview
S
0346.02, 0351.01, 0351.02
13,025
1.94
6714
-4.0
25,078
21.1
22.5
Filipino (6.5%)
06.5% Filipino
Junction Triangle
OCoT
0098.00
6,666
0.72
9258
-6.0
28,067
20.0
18.8
Portuguese (13.0%)
13.0% Portuguese
Kensington Market
OCoT
0038.00
3,740
0.36
10,389
3.0
23,335
15.0
25.1
Cantonese (14.3%)
14.3% Cantonese
Lambton
Y
0151.00, 0154.00
9,654
2.74
3523
-3.2
30,920
14.2
15.9
Portuguese (3.9%)
03.9% Portuguese
L'Amoreaux
S
0375.01, 0375.04, 0375.05, 0376.01, 0376.02, 0376.08, 0376.11,0376.12
45,862
7.15
6414
0.9
26,375
13.4
11.4
Unspecified Chinese (13.9%)
13.9% Unspecified Chinese
Lansing
NY
299.00
10,052
3.06
3285
35.0
46,631
18.7
17.0
Persian (4.7%)
04.7% Persian
Lawrence Heights
NY
286.00
3,769
3.2
1178
15.0
29,867
15.0
13.9
Italian (15.0%)
15.0% Italian
Lawrence Manor
NY
0287.01, 0287.02
13,750
2.14
6425
7.4
36,361
15.9
23.8
Filipino (7.2%)
07.2% Filipino
Lawrence Park
OCoT
0138.00, 0265.00
6,653
3.64
1828
-5.1
214,110
8.3
4.6
French (0.8%)
00.8% French
Ledbury Park
NY
0276.01, 0276.02
12,360
2.5
4944
3.5
83,853
9.5
12.2
Filipino (1.4%)
01.4% Filipino
Leslieville
OCoT
0026.00, 0027.00, 0028.00, 0073.00, 0074.00
23,567
2.69
8761
-7.3
30,886
19.9
15.4
Cantonese (9.4%)
09.4% Cantonese
Little Italy
OCoT
0041.00, 0042.00
7,917
0.81
9774
-6.1
31,231
15.5
17.0
Portuguese (17.4%)
17.4% Portuguese
Little Portugal
OCoT
0044.00
5,013
0.49
10,231
-10.0
29,224
16.6
21.6
Portuguese (23.8%)
23.8% Portuguese
Lytton Park
OCoT
0139.00
6,494
1.28
5073
5.0
127,356
15.1
12.9
Serbian (0.9%)
00.9% Serbian
Malvern
S
0378.03, 0378.04, 0378.05, 0378.06, 0378.11, 0378.12, 0378.16, 0378.17
44,324
8.86
5003
1.5
25,677
13.6
8.2
Tamil (12.2%)
12.2% Tamil
Maple Leaf
NY
0283.01, 0283.02, 0284.00, 285.00
20,313
4.59
4425
1.4
27,611
11.8
18.8
Italian (13.0%)
13.0% Italian
Maryvale
S
0372.00, 0373.00
8,800
2.28
3860
-3.2
30,944
12.3
11.4
Filipino (4.1%)
04.1% Filipino
Milliken
S
0377.06, 0377.07, 0378.18, 0378.19, 0378.20, 0378.21, 0378.22
26,272
7.19
3654
-2.0
25,243
12.3
3.9
Cantonese (26.6%)
26.6% Cantonese
Moore Park
OCoT
0125.00
4,474
1.13
3959
-2.0
154,825
11.0
7.5
French (1.1%)
01.1% French
Morningside
S
0363.02, 0363.04, 0363.05
11,472
2.79
4112
0.3
27,139
14.9
13.2
Tamil (10.8%)
10.8% Tamil
Mount Dennis
Y
0156.01, 0156.02, 0157.00, 0173.00, 0174.00
21,284
3.29
6469
-3.1
23,910
18.2
19.9
Spanish (7.3%)
07.3% Spanish
Newtonbrook
NY
0318.00, 0319.00, 0320.01, 0320.02, 0321.01, 0321.02, 0322.00
36,046
8.77
4110
0.3
33,428
16.6
14.3
Russian (8.8%)
08.8% Russian
Niagara
OCoT
0010.02
6,524
0.55
11,862
-4.0
44,611
21.2
21.4
Portuguese (4.0%)
04.0% Portuguese
North York City Centre
NY
0307.01
10,427
0.28
37,239
33.0
34,330
19.0
19.5
Unspecified Chinese (10.1%)
10.1% Unspecified Chinese
Oakridge
S
0341.02, 0341.03, 0341.04
13,368
1.86
7187
-2.3
21,155
20.8
27.1
Bengali (12.6%)
12.6% Bengali
Old Mill /Baby Point
Y
0150.00
4,010
1.07
3748
1.0
110,372
16.1
10.7
Ukrainian (4.1%)
04.1% Ukrainian
Parkdale
OCoT
0004.00, 0005.00, 0007.01, 0007.02, 0047.01, 0047.02
28,367
2.03
13,974
-8.0
26,314
22.2
39.0
Polish (2.9%)
02.9% Polish
Parkway Forest
NY
0301.03, 0301.04
8,498
1.71
4970
-2.8
24,333
21.7
24.2
Unspecified Chinese (8.5%)
08.5% Unspecified Chinese
Parkwoods
NY
0270.01, 0270.02, 0271.01, 0271.02, 0272.01, 0272.02
26,533
4.96
5349
-3.7
34,811
14.0
22.5
Unspecified Chinese (3.4%)
03.4% Unspecified Chinese
Pelmo Park
NY
0282.00
4,402
2.2
2001
14.0
32,002
9.4
3.6
Italian (6.7%)
06.7% Italian
Playter Estates
OCoT
0085.00
3,968
0.5
7936
-2.0
44,557
26.8
35.0
Unspecified Chinese (1.8%)
01.8% Unspecified Chinese
Pleasant View
NY
0302.01, 0302.02, 0302.03
16,615
3.04
5465
-2.1
29,250
13.2
8.2
Unspecified Chinese (12.7%)
12.7% Unspecified Chinese
Port Lands
OCoT
0001.00
571
6.1
94
-9.0
36,243
14.9
10.5
Mandarin (3.5%)
03.5% Mandarin
Port Union
S
0361.01, 0361.02
12,450
5.39
2310
-1.7
48,117
11.1
2.0
Filipino (1.6%)
01.6% Filipino
Regal Heights
OCoT
0113.00
2,719
0.38
7155
-8.0
36,652
24.5
19.7
Spanish (5.5%)
05.5% Spanish
Regent Park /Trefann Court
OCoT
0030.00, 0031.00
10,387
0.64
16,230
-7.1
19,521
16.0
31.2
Bengali (10.5%)
10.5% Bengali
Richview
E
0237.01, 0237.02, 0237.03, 0238.01, 0238.02, 0240.01
26,053
6.51
4002
-4.0
34,579
10.6
16.3
Italian (4.2%)
04.2% Italian
Riverdale
OCoT
0018.00, 0019.00, 0029.00, 0069.00, 0070.00, 0071.00, 0072.01, 0072.02
31,007
3.99
7771
-5.5
40,139
20.0
17.8
Cantonese (6.7%)
06.7% Cantonese
Rockcliffe–Smythe
Y
0153.00
4,681
0.97
4826
-5.0
28,723
16.3
9.0
Spanish (8.2%)
08.2% Spanish
Roncesvalles
OCoT
0048.00, 0049.00, 0051.00, 0052.00
15,996
1.98
8079
-4.9
46,820
21.9
22.7
Polish (4.4%)
04.4% Polish
Rosedale
OCoT
0086.00, 0087.00
7,672
2.72
2821
4.8
213,941
11.3
11.9
Unspecified Chinese (1.0%)
01.0% Unspecified Chinese
Rouge
S
0378.10
22,724
28.72
791
175.0
29,230
12.1
2.7
Tamil (15.6%)
15.6% Tamil
Rouge Hill
S
0362.01, 0362.04
11,167
3.88
2878
0.9
32,858
13.5
8.6
Filipino (2.4%)
02.4% Filipino
Runnymede
Y
0152.00
4,382
0.85
5155
-3.0
42,635
17.3
7.1
Ukrainian (2.2%)
02.2% Ukrainian
Scarborough Junction
S
0342.00, 0343.00, 0344.01, 0344.02, 0345.00, 0346.01, 0347.00
25,780
7.41
3479
-3.6
25,405
18.2
15.7
Tamil (4.2%)
04.2% Tamil
Scarborough City Centre
S
0363.06, 0370.01
16,403
2.58
6358
22.9
26,756
14.6
15.6
Tamil (10.3%)
10.3% Tamil
Scarborough Village
S
0331.03, 0332.00
12,796
2.03
6303
-9.0
24,413
16.2
22.0
Tamil (11.4%)
11.4% Tamil
Seaton Village
OCoT
0093.00
5,259
0.62
8482
-6.0
41,506
19.1
17.3
Portuguese (5.0%)
05.0% Portuguese
Silverthorn
Y
0158.00, 0159.01, 0159.02, 0171.00, 0172.00
17,757
3.52
5045
-3.0
26,291
15.8
16.6
Portuguese (11.8%)
11.8% Portuguese
Smithfield
E
0248.02, 0248.04, 0248.05, 0249.01, 0249.04, 0249.05, 0250.04
34,996
6.45
5426
-7.2
24,387
12.8
12.7
Punjabi (11.8%)
11.8% Punjabi
South Hill
OCoT
0117.00, 0119.00
6,218
1.26
4935
-3.8
120,453
16.1
29.8
French (1.0%)
01.0% French
St. James Town
OCoT
0065.00
14,666
0.23
63,765
-10.0
22,341
27.4
46.2
Filipino (8.1%)
08.1% Filipino
Steeles
S
0376.04, 0376.05, 0376.09, 0376.13, 0376.14
24,696
4.52
5464
1.9
26,660
10.5
5.1
Cantonese (23.7%)
23.7% Cantonese
Summerhill
OCoT
0090.00, 0120.00
5,100
0.65
7846
3.0
88,937
17.5
24.1
Unspecified Chinese (1.1%)
01.1% Unspecified Chinese
Sunnylea
E
0216.00, 0217.00, 0218.00, 0219.00
17,602
5.23
3366
-1.1
51,398
13.0
17.1
Polish (5.2%)
05.2% Polish
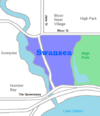
Swansea
OCoT
0050.01, 0050.02
11,133
3.76
2961
0.5
58,681
18.3
12.8
Polish (3.0%)
03.0% Polish
Tam O'Shanter – Sullivan
S
0374.01, 0374.02, 0374.03, 0375.02, 0375.03, 0376.07
27,235
5.44
5006
3.4
27,717
12.2
15.3
Unspecified Chinese (12.6%)
12.6% Unspecified Chinese
The Annex
OCoT
0091.01, 0091.02, 0092.00
15,602
1.47
10,614
-2.3
63,636
22.1
41.9
Spanish (1.3%)
01.3% Spanish
The Beaches
OCoT
0020.00, 0021.00, 0022.00, 0023.00, 0024.00
20,416
3.57
5719
7.8
67,536
13.8
16.2
Cantonese (0.7%)
00.7% Cantonese
The Danforth
OCoT
83.00, 84.00
7,849
0.87
9022
-1.0
44,979
23.3
19.0
Greek (7.4%)
07.4% Greek
The Elms
E
0244.01, 0244.02
9,437
2.86
3300
-3.3
28,014
12.6
13.7
Spanish (6.1%)
06.1% Spanish
The Junction
OCoT
0101.00, 0105.00, 0106.00
11,391
2.36
4827
22.8
34,906
18.0
17.0
Portuguese (4.1%)
04.1% Portuguese
The Kingsway
E
0226.00, 0227.00, 0228.00, 0229.00
8,780
2.58
3403
7.9
110,944
11.8
6.2
Ukrainian (1.8%)
01.8% Ukrainian
The Queensway
E
0215.00
6,207
2.62
2369
3.0
38,944
12.9
9.0
Italian (4.1%)
04.1% Italian
Thistletown
E
0250.01, 0250.02, 0250.05
16,790
3.97
4229
1.4
28,955
11.2
13.7
Punjabi (8.6%)
08.6% Punjabi
Toronto Islands
OCoT
0002.00
627
3.17
198
-5.0
43,344
18.3
5.6
None (0%)
0% any
Trinity–Bellwoods
OCoT
0040.00, 0043.00
8,687
0.92
9442
-3.1
31,106
17.7
16.5
Portuguese (13.6%)
13.6% Portuguese
Upper Beaches
OCoT
0025.00, 0077.00, 0078.00, 0079.00
19,830
2.92
6791
0.5
44,346
18.6
17.4
Cantonese (0.7%)
00.7% Cantonese
Victoria Village
NY
0261.00, 0262.01, 0262.02
17,047
4.72
3612
2.5
29,657
15.6
23.4
Urdu (3.2%)
03.2% Urdu
Wallace Emerson
OCoT
0097.01, 0097.02
10,338
0.88
11,748
-1.8
25,029
22.8
23.0
Portuguese (19.2%)
19.2% Portuguese
West Deane Park
E
0234.00
4,395
2.13
2063
1.0
41,582
8.3
4.9
Ukrainian (2.3%)
02.3% Ukrainian
West Hill
S
0358.01, 0358.02, 0358.03, 0359.00, 0360.00
25,632
9.58
2676
-4.1
27,936
14.6
14.7
Tamil (3.0%)
03.0% Tamil
West Rouge
S
0802.01, 0802.02
9,300
4.45
2090
-1.8
44,605
14.1
0.8
Cantonese (2.8%)
02.8% Cantonese
Westminster
NY
0317.02, 0317.03, 0317.04
16,386
2.37
6914
0.8
27,826
14.6
23.4
Russian (31.4%)
31.4% Russian
Westmount
E
0240.02
5,857
1.04
5932
5.0
35,183
9.6
23.4
Ukrainian (10.6%)
10.6% Ukrainian
Weston
Y
0175.01, 0175.02, 0176.00
16,476
2.51
6564
-5.6
27,446
15.5
26.5
Spanish (7.0%)
07.0% Spanish
Wexford
S
0349.00, 0350.00, 0371.00
17,844
7.97
2239
-3.2
28,556
14.0
15.1
Filipino (4.5%)
04.5% Filipino
Willowdale
NY
0300.00, 0306.01, 0306.02, 0307.02, 0308.01, 0308.02
43,144
7.68
5618
62.3
39,895
15.6
12.9
Cantonese (7.9%)
07.9% Cantonese
Wilson Heights
NY
0288.00, 0297.02
13,732
4.14
3317
1.9
37,978
15.9
18.0
Filipino (6.2%)
06.2% Filipino
Woburn
S
0356.00, 0357.01, 0357.02, 0363.07, 0364.01, 0364.02, 0365.00, 0366.00, 0367.01
48,507
13.34
3636
-1.5
26,190
13.3
16.0
Gujarati (9.1%)
09.1% Gujarati
Wychwood
OCoT
0116.00
4,182
0.68
6150
-2.0
53,613
17.1
20.1
Portuguese (2.7%)
02.7% Portuguese
York Mills
NY
0273.01, 0273.02, 0274.01, 0274.02
17,564
7.29
2409
2.0
92,099
10.0
11.8
Korean (4.0%)
04.0% Korean
York University Heights
NY
0311.02, 0311.03, 0311.04, 0311.05, 0311.06
26,140
13.21
1979
-1.2
24,432
15.2
20.4
Italian (6.6%)
06.6% Italian
Yorkville
OCoT
0088.00, 0089.00
6,045
0.56
10,795
62.6
105,239
18.3
27.9
French (1.9%)
01.9% French
See also
References


