Share to:


Laz, Finistère

Laz
Laz
The church of Saint-Germain and Saint-Louis, in Laz
Coat of arms of Laz
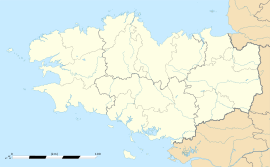
Location of Laz
Map
Laz is located in France
Laz
Laz
Laz is located in Brittany
Laz
Laz
Coordinates: 48°08′18″N 3°50′02″W / 48.1383°N 3.8339°W / 48.1383; -3.8339
CountryFrance
RegionBrittany
DepartmentFinistère
ArrondissementChâteaulin
CantonBriec
IntercommunalityHaute Cornouaille
Government
 • Mayor (2020–2026) Annick Barré[1]
Area
1
34.44 km2 (13.30 sq mi)
Population
 (2022)[2]
684
 • Density20/km2 (51/sq mi)
Time zoneUTC+01:00 (CET)
 • Summer (DST)UTC+02:00 (CEST)
INSEE/Postal code
29122 /29520
Elevation31–295 m (102–968 ft)
1 French Land Register data, which excludes lakes, ponds, glaciers > 1 km2 (0.386 sq mi or 247 acres) and river estuaries.

Laz (French pronunciation: [laz]) is a commune in the Finistère department of Brittany in north-western France.

Geography

The commune is situated at the heart of a hilly and forest-covered region called the Montagnes Noires (black mountains) which extends for approximately 30 kilometres between the communes of Gourin to the east and Gouezec in the west.

The population of the commune is quite scattered, forming small settlements that could be considered as hamlets. Laz offers outlooks over the valley of the Odet to the south and the canalized Aulne river and its locks to the north.

Map

Topographic map

Economy

Agricultural development was held back by the French Revolution and the subsequent royalist revolt, combined with poor soil conditions. The commune started to grow in the middle of the 19th century, when the use of fertiliser and other new techniques allowed the land to be brought into full agricultural use.

Population

Inhabitants of Laz are called in French Laziens.

Historical population
YearPop.±% p.a.
1793 1,280—    
1800 1,383+1.11%
1806 1,133−3.27%
1821 1,291+0.87%
1831 1,358+0.51%
1836 1,429+1.02%
1841 1,404−0.35%
1846 1,555+2.06%
1851 1,433−1.62%
1856 1,242−2.82%
1861 1,251+0.14%
1866 1,250−0.02%
1872 1,201−0.66%
1876 1,209+0.17%
1881 1,238+0.48%
1886 1,245+0.11%
1891 1,203−0.68%
1896 1,313+1.77%
YearPop.±% p.a.
1901 1,389+1.13%
1906 1,412+0.33%
1911 1,464+0.73%
1921 1,383−0.57%
1926 1,384+0.01%
1931 1,370−0.20%
1936 1,290−1.20%
1946 1,211−0.63%
1954 1,115−1.03%
1962 1,025−1.05%
1968 996−0.48%
1975 863−2.03%
1982 786−1.33%
1990 706−1.33%
1999 694−0.19%
2007 767+1.26%
2012 685−2.24%
2017 661−0.71%
Source: EHESS[3] and INSEE (1968-2017)[4]

See also

References

  1. ^ "Répertoire national des élus: les maires". data.gouv.fr, Plateforme ouverte des données publiques françaises (in French). 2 December 2020.
  2. ^ "Populations de référence 2022" (in French). The National Institute of Statistics and Economic Studies. 19 December 2024.
  3. ^ Des villages de Cassini aux communes d'aujourd'hui: Commune data sheet Laz, EHESS (in French).
  4. ^ Population en historique depuis 1968, INSEE
Kembali kehalaman sebelumnya