|
Manufacturing in the United States
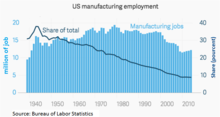
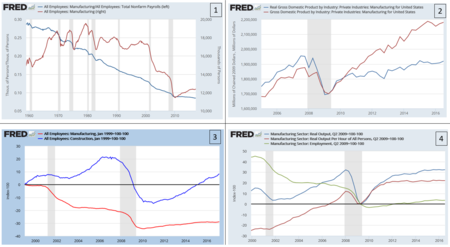
 Manufacturing is a vital economic sector in the United States of America.[1] The United States is the world's second-largest manufacturer after the People's Republic of China with a record high real output in 2021 of $2.5 trillion.[2] As of December 2016, the U.S. manufacturing industry employed 12.35 million people. A year later, in December 2017, U.S. manufacturing employment grew by 207,000, or 1.7%, employees.[3] Though still a large part of the US economy, in Q1 2018 manufacturing contributed less to GDP than the 'Finance, insurance, real estate, rental, and leasing' sector, the 'Government' sector, or 'Professional and business services' sector.[3] Manufacturing output recovered from the Great Recession, reaching an all-time high in 2021, but manufacturing employment has been declining since the 1990s, giving rise to what is known as a "jobless recovery," which made job creation or preservation in the manufacturing sector an important topic in the 2016 United States presidential election.[4] Employment  Manufacturing jobs helped build out the U.S. middle class following World War II, as the U.S. established pro-labor policies and faced limited global competition. Between 1980 and 1985, and then again 2001 to 2009, there were precipitous declines in US manufacturing jobs; it is estimated that 1/3 of U.S. manufacturing jobs vanished in the eight years between 2001 and 2009, and few have returned, the worst period for U.S. manufacturing since the Great Depression.[5] Since 1979, the number of U.S. manufacturing employment has been declining, especially the sharp decline in 2001 and 2007. The way in which employment in the U.S. manufacturing industry has fallen provides a series of potential policy responses including insights into how the industry is changing, and unemployment.[6] There are several possible explanations for the decline. Bill Lazonick argues that legalization of companies buying their own shares of stock in 1982 has led to sustained stock market bubbles that distorted investment away from physical plant.[7] Others point to automation or developments outside the United States, such as the rise of China, globalized free trade, and supply chain innovation. These have arguably resulted in the off-shoring of thousands of U.S. manufacturing facilities and millions of manufacturing jobs to lower-wage countries. Meanwhile, technological innovation has increased productivity significantly, meaning that manufacturing output in the United States has increased by 80% since the 1980s, despite large job losses in the manufacturing sector during that same period.[8][9] The Bureau of Labor Statistics (BLS) forecast in October 2017 that manufacturing employment would fall from 12.3 million in 2016 to 11.6 million in 2026, a decline of 736,000 employees over a decade. As a share of employment, manufacturing was estimated to fall from 7.9% of the total U.S. economy in 2016 to 6.9% of it in 2026, continuing a long-term downward trend.[10] The U.S. manufacturing industry employed 12.4 million people in March 2017,[3] generating output (nominal GDP) of $2.2 trillion in Q3 2016, with real GDP of $1.9 trillion in 2009 dollars.[11] The share of persons employed in manufacturing relative to total employment has steadily declined since the 1960s. Employment growth in industries such as construction, finance, insurance and real estate, and services industries played a significant role in reducing manufacturing's overall share of U.S. employment. In 1990, services surpassed manufacturing as the largest contributor to overall private industry production, and then the finance, insurance and real estate sector surpassed manufacturing in 1991. Since the entry of China into the World Trade Organization in December 2001, the decline in manufacturing jobs has accelerated.[8] The U.S. goods trade deficit (imports greater than exports) with China was approximately $350 billion in 2016.[12] However it is possible that the import of goods from China is a result rather than a cause. The US stock market also ended a sustained fourteen year bubble in 2001, and the ensuing job loss pushed a significant portion of US population below the poverty line. The Economist reported in January 2017 that manufacturing historically created good paying jobs for workers without a college education, particularly for men. The jobs paid well enough so that women did not have to work when they had young children. Unions were strong and owners did not want to risk strikes in their factories due to large capital investments and significant on the job training. Such jobs are much less available in the post-2001 era in the U.S. though they remain available in Germany, Switzerland and Japan, leading to calls to bring those jobs back from overseas, establish protectionism, and reduce immigration. Making it illegal for companies to purchase shares of their own stock has not yet gained traction as a remedy for the diversion of operating profits away from reinvestment in equipment and people. Manufacturing continues to evolve, due to factors such as information technology, supply chain innovations such as containerization, companies un-bundling tasks that used to be in one location or business, reduced barriers to trade, and competition from low-cost developing countries such as China and Mexico. Competition from high wage nations such as Germany is also increasing.[4] History Between 1980 and 1985, U.S. manufacturing was impacted negatively as Japanese productivity rose at a rapid rate, leading to a fall of 12% in Japanese products, and the increase in U.S. interest rates that led to the appreciation of the U.S. dollar. This was the opposite policy from that which a rise in Japanese productivity would have dictated, and the US policy action made Japanese products 30% cheaper than American until 1986. The US machine tool sector never recovered from this body blow.[13] Between 1983 and 2005, U.S. exports grew by 340%, with exports of manufactured goods increasing by 407% over this period. In 1983, the primary export commodities of the U.S. was transportation equipment, computer and electronic products, agricultural products, machinery (except electrical), chemicals, and food and kindred products. Together these commodities totaled 69 percent of total U.S. exports. By 2005, the primary export commodities were largely the same: computer and electronic products, transportation equipment, chemicals, machinery (except electrical), miscellaneous manufactured commodities, and agricultural products. Together these commodities accounted for 69 percent of total U.S. merchandise exports. Between 1983 and 2005, exports of computer and electronic products grew by 493%, overtaking transportation as the leading export commodity, which grew by 410%. Though agricultural products exports grew by 26% during this period, its share of overall merchandise exports fell from 12% in 1983 to 4% in 2005. In 1983, the top trading partners for U.S. exports were Canada (21% of total merchandise exports), Japan (11%), United Kingdom (5%), Mexico (4%), Germany (4%), the Netherlands (4%), Saudi Arabia (3%), France (3%), South Korea (3%), and Belgium and Luxembourg (2%). In 2005, the top markets for U.S. exports were Canada (24%), Mexico (13%), Japan (6%), China (5%), United Kingdom (4%), Germany (4%), South Korea (3%), the Netherlands (3%), France (2%), and Taiwan (2%). Between 1983 and 2005, exports to Mexico increased by 1,228%, allowing it to replace Japan as the second-largest market for U.S. exports. In the first quarter of 2010, overall U.S. merchandise exports increased by 20 percent compared to the first quarter of 2009, with manufactured goods exports increasing by 20 percent. As in 2009, the highest export commodities were transportation equipment, computer and electronic products, chemicals, machinery (except electrical), agricultural products, and miscellaneous manufactured commodities. In the first quarter of 2010, the primary markets for U.S. merchandise exports were Canada, Mexico, China, Japan, the United Kingdom, Germany, South Korea, Brazil, the Netherlands, and Singapore. With the exception of the Netherlands, exports to all of these countries increased in the first quarter of 2010, compared to the same quarter in 2009. Notably, exports to Canada increased by 22 percent, Mexico by 28 percent, and China by 47 percent over this period. Exports to the two NAFTA partners accounted for nearly one-third (32%) of U.S. merchandise trade in the first quarter of 2010. The panel chart in this section includes four diagrams describing manufacturing labor, output, and productivity historical trends through 2016:
Forecast The Bureau of Labor Statistics projected in October 2017 that:
Trade policyU.S. manufacturing employment has declined steadily as a share of total employment, from around 28% in 1960 to 8% in March 2017. Manufacturing employment has fallen from 17.2 million persons in December 2000 to 12.4 million in March 2017, a decline of about 5.7 million or about one-third even as the U.S.population ballooned from 220 million to 330 million in the same time frame.[3] An estimated 1–2 million of the job losses in manufacturing 1999–2011 were due to competition with China (the China shock), which entered the World Trade Organization in December 2001.[8] The Economic Policy Institute estimated that the trade deficit with China cost about 2.7 million jobs between 2001 and 2011, including manufacturing and other industries.[21] While U.S. manufacturing employment is down, output was near a record level in 2017 in real GDP terms, indicating productivity (output per worker) has also improved significantly.[22] This is likely due to automation, global supply chains, process improvements, and other technology changes.[8] Economist Paul Krugman argued in December 2016 that "America's shift away from manufacturing doesn't have much to do with trade, and even less to do with trade policy." He also cited the work of other economists indicating that the declines in manufacturing employment from 1999 to 2011 due to trade policy generally and trade with China specifically were "less than a fifth of the absolute loss of manufacturing jobs over the period" but that the effects were significant for regions directly impacted by those losses.[23] Modern overviewThe United States is the world's third largest manufacturer (after China and the European Union) with a record high real output in Q1 2018 of $2.00 trillion (i.e., adjusted for inflation in 2009 Dollars) about one percent above the 2007 peak before the Great Recession of $1.95 trillion.[11] The U.S. manufacturing industry employed 12.35 million people in December 2016 and 12.56 million in December 2017, an increase of 207,000 or 1.7%.[3] Historically, manufacturing has provided relatively well-paid blue-collar jobs, although this has been affected by globalization and automation. Manufacturing continues to evolve, due to factors such as information technology, supply chain innovations such as containerization, companies un-bundling tasks that used to be in one location or business, reduced barriers to trade, and competition from low-cost developing countries such as China and Mexico.[4] Manufacturing is conducted among globally distributed supply chains, with various stages of production conducted in different countries.[24] For example, automotive parts may be manufactured in the U.S., shipped to Mexico for assembly, then sent back to the U.S. In some cases, the components of the final product cross the border multiple times. An estimated 40% of the value of U.S. imports from Mexico is from content produced in the U.S.; this figure is 25% for Canada but only 4% for China. This "production sharing" is an indication of the integrated nature of the supply chains between the U.S., Mexico and Canada in the NAFTA region.[25] Trade balanceDuring 2016, the U.S. exported $1,051 billion in manufactured goods and imported $1,920 billion, a manufacturing goods deficit of $868 billion. The largest exports were transportation equipment ($252B), Chemicals ($174B), Computers and Electronic Products ($116B) and "Machinery-Except Electrical" ($109B).[26] IndustriesAs of 2019, durable and nondurable goods manufacturing account for $3.1t and $3t of gross output of GDP, respectively.[27] However, 2023 research from McKinsey states that GDP numbers don't accurately capture manufacturing's economic impact. In its findings, while manufacturing accounted for 11 percent of US GDP and 8 percent of direct employment, it drove 20 percent of capital investment, 30 percent of productivity growth, 60 percent of the country's exports, and garnered 70 percent of business research and development funding. [28] International comparisonThe Congressional Research Service reported in January 2017 that:
See also
Further reading
References
|
