|
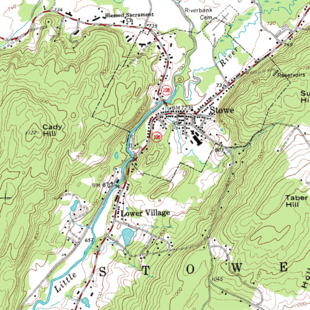
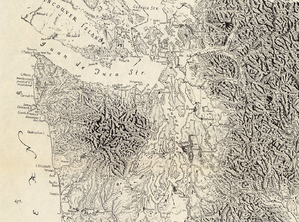
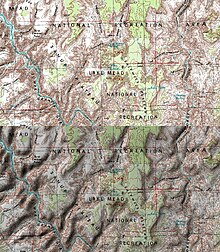
Terrain cartography Terrain cartography or relief mapping is the depiction of the shape of the surface of the Earth on a map, using one or more of several techniques that have been developed. Terrain or relief is an essential aspect of physical geography, and as such its portrayal presents a central problem in cartographic design, and more recently geographic information systems and geovisualization. Hill profiles The most ancient form of relief depiction in cartography, hill profiles are simply illustrations of mountains and hills in profile, placed as appropriate on generally small-scale (broad area of coverage) maps. They are seldom used today except as part of an "antique" styling. Physiographic illustration In 1921, A.K. Lobeck published A Physiographic Diagram of the United States, using an advanced version of the hill profile technique to illustrate the distribution of landforms on a small-scale map.[1] Erwin Raisz further developed, standardized, and taught this technique, which uses generalized texture to imitate landform shapes over a large area.[2] A combination of hill profile and shaded relief, this style of terrain representation is simultaneously idiosyncratic to its creator—often hand-painted—and found insightful in illustrating geomorphological patterns. Plan oblique relief More recently, Tom Patterson developed a computer-generated technique for mapping terrain inspired by Raisz's work, called plan oblique relief.[3] This tool starts with a shaded relief image, then shifts pixels northward proportional to their elevation. The effect is to make mountains "stand up" and "lay over" features to the north, in the same fashion as hill profiles. Some viewers are able to see the effect more easily than others. Hachures Hachures, first standardized by the Austrian topographer Johann Georg Lehmann in 1799, are a form of shading using lines. They show the orientation of slope, and by their thickness and overall density they provide a general sense of steepness. Being non-numeric, they are less useful to a scientific survey than contours, but can successfully communicate quite specific shapes of terrain.[2] They are especially effective at showing relatively low relief, such as rolling hills. It was a standard on topographic maps of Germany well into the 20th Century. There have been multiple attempts to recreate this technique using digital GIS data, with mixed results. Contour linesFirst developed in France in the 18th Century, contour lines (or isohypses) are isolines of equal elevation. This is the most common way of visualizing elevation quantitatively, and is familiar from topographic maps. Most 18th- and early 19th-century national surveys did not record relief across the entire area of coverage, calculating only spot elevations at survey points. The United States Geological Survey (USGS) topographical survey maps included contour representation of relief, and so maps that show relief, especially with exact representation of elevation, came to be called topographic maps (or "topo" maps) in the United States, and the usage has spread internationally.  On maps produced by Swisstopo, the color of the contour lines is used to indicate the type of ground: black for bare rock and scree, blue for ice and underwater contours, and brown for earth-covered ground.[4] Tanaka (relief) contoursThe Tanaka (relief) contours technique is a method used to illuminate contour lines in order to help visualize terrain. Lines are highlighted or shaded depending on their relationship to a light source in the Northwest. If the object being illustrated would shadow a section of contour line, that contour would be represented with a black band. Otherwise, slopes facing the light source would be represented by white bands. This method was developed by Professor Tanaka Kitiro in 1950, but had been experimented with as early as 1870, with little success due to technological limitations in printing. The resulting terrain at this point was a grayscale image.[5] Cartographer Berthold Horn later created software to digitally produce Tanaka Contours, and Patrick Kennelly, another cartographer, later found a way to add color to these maps, making them more realistic.[6] There are a number of issues with this method. Historically, printing technology did not reproduce Tanaka contours well, especially the white lines on a gray background. This method is also very time-consuming. In addition, the terraced appearance does not look appealing or accurate in some kinds of terrain.[7] Hypsometric tintsHypsometric tints (also called layer tinting, elevation tinting, elevation coloring, or hysometric coloring) are colors placed between contour lines to indicate elevation. These tints are shown as bands of color in a graduated scheme or as a color scheme applied to contour lines themselves; either method is considered a type of Isarithmic map. Hypsometric tinting of maps and globes is often accompanied by a similar method of bathymetric tinting to convey differences in water depth. Shaded relief Bottom: the same map with sun shading. Shaded relief, or hill-shading, shows the shape of the terrain in a realistic fashion by showing how the three-dimensional surface would be illuminated from a point light source. The shadows normally follow the convention of top-left lighting in which the light source is placed near the upper-left corner of the map. If the map is oriented with north at the top, the result is that the light appears to come from the north-west. Although this is unrealistic lighting in the northern hemisphere, using a southern light source can cause multistable perception illusions, in which the topography appears inverted.[8] Shaded relief was traditionally drawn with charcoal, airbrush and other artist's media. The Swiss cartographer Eduard Imhof is widely regarded as a master of manual hill-shading technique and theory. Shaded relief is today almost exclusively computer-generated from digital elevation models (DEM). The mathematical basis of analytical hillshading is to calculate the surface normal at each location, then calculate the angle between that vector and the vector pointing to the illumination using the Dot product; the smaller that angle, the more illumination that location is receiving. However, most software implementations use algorithms that shorten those calculations. This tool is available in a variety of GIS and graphics software, including Photoshop, QGIS, GRASS GIS or ArcMap's Spatial Analyst extension. While these relatively simple tools have made shaded relief almost ubiquitous in maps, many cartographers[weasel words] have been unhappy with the product,[which?] and have developed techniques to improve its appearance, including the following: Illuminated shadingImhof's contributions included a multi-color approach to shading, with purples in valleys and yellows on peaks, which is known as “illuminated shading.” Illuminating the sides of the terrain facing the light source with yellow colors provides greater realism (since direct sunlight is more yellow, and ambient light is more blue), enhances the sense of the three-dimensional nature of the terrain, and make the map more aesthetically pleasing and artistic-looking.[9] Much work has been done in digitally recreating the work of Eduard Imhof, which has been fairly successful in some cases.[10] Multi-directional shading A common criticism of computer-generated analytical hillshading is its stark, artificial look, in which slopes facing the light are solid white, and slopes facing away are solid black. Raisz called it "plastic shading," and others have said it looks like a moonscape.[2] One solution is to incorporate multiple lighting directions to imitate the effect of ambient lighting, creating a much more realistic looking product. Multiple techniques have been proposed for doing this, including using Geographic information systems software for generating multiple shaded relief images and averaging them together, using 3-d modeling software to render terrain,[11] and custom software tools to imitate natural lighting using up to hundreds of individual sources.[12] This technique has been found to be most effective for very rugged terrain at medium scales of 1:30,000 to 1:1,000,000. Texture/bump mapping It is possible to make the terrain look more realistic by imitating the three-dimensional look of not only the bare land surface, but also the features covering that land surface, such as buildings and plants. Texture mapping or bump mapping is a technique adapted from Computer graphics that adds a layer of shaded texture to the shaded surface relief that imitates the look of the local land cover.[13] This texture can be generated in several ways:
This technique is most useful at producing realistic maps at relatively large scales, 1:5,000 to 1:50,000. Resolution mixing or bumping One challenge with shaded relief, especially at small scales (1:500,000 or less), is that the technique is very good at visualizing local (high-frequency) relief, but may not effectively show larger features. For example, a rugged area of hills and valleys will show as much or more variation than a large, smooth mountain. Resolution bumping is a hybrid technique developed by NPS cartographer Tom Patterson to mitigate this problem.[16] A fine-resolution DEM is averaged with a heavily smoothed version (i.e., significantly coarser resolution). When the hillshading algorithm is applied to this, it has the effect of blending the fine details of the original terrain model with the broader features brought out by the smoothed model. This technique works best at small scales and in regions that are consistently rugged. Oblique view A three-dimensional view (projected onto a two-dimensional medium) of the surface of the Earth, along with the geographic features resting on it. Imagined aerial views of cities were first produced during the late Middle Ages, but these "bird's eye views" became very popular in the United States during the 1800s. The advent of GIS (especially recent advances in 3-D and global visualization) and 3-D graphics modeling software has made the production of realistic aerial views relatively easy, although the execution of quality Cartographic design on these models remains a challenge.[17] Raised-relief map This is a map in which relief is shown as a three-dimensional object. The most intuitive way to depict relief is to imitate it at scale. Hand-crafted dioramas may date back to 200BCE in China, but mass production did not become available until World War II with the invention of vacuum-formed plastic maps, and computerized machining to create molds efficiently. Machining is also used to create large custom models from substrates such as high-density foam, and can even color them based on aerial photography by placing an inkjet printhead on the machining device. The advent of 3D printing has introduced a much more economical means to produce raised-relief maps, although most 3D printers are too small to efficiently produce large dioramas.[18] Rendering Terrain rendering covers a variety of methods of depicting real-world or imaginary world surfaces. Most common terrain rendering is the depiction of Earth's surface. It is used in various applications to give an observer a frame of reference. It is also often used in combination with rendering of non-terrain objects, such as trees, buildings, rivers, etc. There are two major modes of terrain rendering: top-down and perspective rendering. Top-down terrain rendering has been known for centuries in the way of cartographic maps. Perspective terrain rendering has also been known for quite some time. However, only with the advent of computers and computer graphics perspective rendering has become mainstream. Structure A typical terrain rendering application consists of a terrain database, a central processing unit (CPU), a dedicated graphics processing unit (GPU), and a display. A software application is configured to start at initial location in the world space. The output of the application is screen space representation of the real world on a display. The software application uses the CPU to identify and load terrain data corresponding to initial location from the terrain database, then applies the required transformations to build a mesh of points that can be rendered by the GPU, which completes geometrical transformations, creating screen space objects (such as polygons) that create a picture closely resembling the location of the real world. TextureThere are a number of ways to texture the terrain surface. Some applications benefit from using artificial textures, such as elevation coloring, checkerboard, or other generic textures. Some applications attempt to recreate the real-world surface to the best possible representation using aerial photography and satellite imagery. In video games, texture splatting is used to texture the terrain surface. GenerationThere are a great variety of methods to generate terrain surfaces. The main problem solved by all these methods is managing number of processed and rendered polygons. It is possible to create a very detailed picture of the world using billions of data points. However such applications are limited to static pictures. Most uses of terrain rendering are moving images, which require the software application to make decisions on how to simplify (by discarding or approximating) source terrain data. Virtually all terrain rendering applications use level of detail to manage number of data points processed by CPU and GPU. There are several modern algorithms for terrain surfaces generating.[19][20][21][22] ApplicationsTerrain rendering is widely used in computer games to represent both Earth's surface and imaginary worlds. Some games also have terrain deformation (or deformable terrain). One important application of terrain rendering is in synthetic vision systems. Pilots flying aircraft benefit greatly from the ability to see terrain surface at all times regardless of conditions outside the aircraft. Skeletal, structural, or break lines
Emphasizes hydrological drainage divide and watershed streams. Forums and associationsPortrayal of relief is especially important in mountainous regions. The Commission on Mountain Cartography of the International Cartographic Association is the best-known forum for discussion of theory and techniques for mapping these regions. See also
References
External linksWikimedia Commons has media related to Topographic shading.
|