|
Tunica County, Mississippi
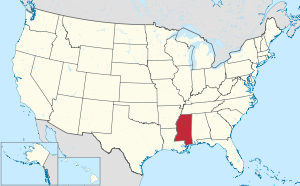
Tunica County is a county located in the U.S. state of Mississippi. As of the 2020 census, the population was 9,782.[1] Its county seat is Tunica.[2] The county is named for the Tunica Native Americans. Most migrated to central Louisiana during the colonial period. Tunica County is part of the Memphis, TN-MS-AR Metropolitan Statistical Area. It is located in the Mississippi Delta region. Since the late 20th century, it is known for Tunica Resorts (formerly Robinsonville), an unincorporated community that is the site of six casino resorts. It is one of the top six destinations in the country in terms of gambling revenues.[3] GeographyAccording to the U.S. Census Bureau, the county has a total area of 481 square miles (1,250 km2), of which 455 square miles (1,180 km2) is land and 26 square miles (67 km2) (5.4%) is water.[4] Major highwaysAdjacent counties
Demographics
 2020 census
As of the 2020 United States Census, there were 9,782 people, 3,930 households, and 2,347 families residing in the county. 2010 censusAs of the 2010 United States Census, there were 10,778 people living in the county. 73.5% were Black or African American, 23.7% White, 0.6% Asian, 0.1% Native American, 0.1% Pacific Islander, 1.2% of some other race and 0.9% of two or more races. 2.3% were Hispanic or Latino (of any race). 2000 censusAs of the census[12] of 2000, there were 9,227 people, 3,258 households, and 2,192 families living in the county. The population density was 20 people per square mile (7.7 people/km2). There were 3,705 housing units at an average density of 8 units per square mile (3.1 units/km2). The racial makeup of the county was 70.15% Black or African American, 27.54% White, 0.11% Native American, 0.42% Asian, 0.07% Pacific Islander, 0.96% from other races, and 0.75% from two or more races. 2.53% of the population were Hispanic or Latino of any race. There were 3,258 households, out of which 33.30% had children under the age of 18 living with them, 33.90% were married couples living together, 26.90% had a female householder with no husband present, and 32.70% were non-families. 26.90% of all households were made up of individuals, and 9.90% had someone living alone who was 65 years of age or older. The average household size was 2.80 and the average family size was 3.44. In the county, the population was spread out, with 31.50% under the age of 18, 10.90% from 18 to 24, 27.40% from 25 to 44, 20.20% from 45 to 64, and 10.10% who were 65 years of age or older. The median age was 31 years. For every 100 females there were 91.10 males. For every 100 females age 18 and over, there were 85.90 males. The median income for a household in the county was $23,270, and the median income for a family was $25,443. Males had a median income of $25,244 versus $18,104 for females. The per capita income for the county was $11,978. About 28.10% of families and 33.10% of the population were below the poverty line, including 43.40% of those under age 18 and 32.50% of those age 65 or over. EconomyGreenTech Automotive received $6 million of incentive financing from the state of Mississippi and Tunica County to build an automotive plant in the county.[13][14] The facility was shut down in January 2017.[15] GreenTech had promised to invest $60 million in the manufacturing plant, but it produced few cars if any.[13] A Mississippi state auditor's review begun in 2016 found documentation reflecting only $3 million spent by GreenTech on automotive assembly equipment and parts.[13] While the company had promised to create 350 full-time jobs, it was found to never have created more than 94 active, full-time jobs in Mississippi at any time.[13][16] In July 2017, the Mississippi state auditor demanded that GreenTech and its CEO Charlie Wang pay Mississippi $6 million because Greentech had not lived up to its promises to invest $60 million and create 350 jobs in Tunica County.[16][17] The auditor said: "I would venture that there isn’t really much of an operation in Tunica at all. This appears to have been a game of smoke and mirrors, and a corporate entity that never had any intention to deliver on the promises it made."[17] In November 2017, Mississippi Attorney General Jim Hood sued the company for $3 million, plus forfeiture of land used for the Tunica factory.[16] GreenTech declared bankruptcy in February 2018.[18][19] In a 2020 final settlement, it paid Mississippi and Tunica County only $575,000.[13] Education
Notable people
CommunitiesTown
Census-designated places
Unincorporated communitiesGhost townsPolitics
See alsoNational Register of Historic Places listings in Tunica County, Mississippi ReferencesWikimedia Commons has media related to Tunica County, Mississippi.
External links |
|||||||||||||||||||||||||||||||||||||||||||||||||||||||||||||||||||||||||||||||||||||||||||||||||||||||||||||||||||||||||||||||||||||||||||||||||||||||||||||||||||||||||||||||||||||||||||||||||||||||||||||||||||||||||||||||||||||||||||||||||||||||||||||||||||||||||||||||||||||||||||||||||||||||||||||||||||||||||||||||||||||||||||||||||||||||||||||||||||||||||||||||||||


