1936 United States presidential election in Maryland
1936 United States presidential election in Maryland
County Results
Roosevelt
50-60%
60-70%
Landon
40-50%
50-60%
The 1936 United States presidential election in Maryland took place on November 3, 1936, as part of the 1936 United States presidential election . State voters chose eight[ 2] Electoral College , who voted for president and vice president .
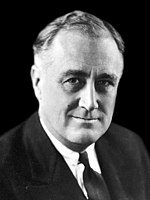
Maryland was won by incumbent President Franklin D. Roosevelt (D –New York ), running with Vice President John Nance Garner , with 62.35% of the popular vote, against Governor Alf Landon (R –Kansas ), running with Frank Knox , with 37.04% of the popular vote.[ 3] [ 4]
Maryland weighed in for this election as Roosevelt’s strongest performance in any of the border states . In this election, Maryland voted 1.06% to the left of the nation at-large.[ 5]
Results
Results by county
County
Franklin Delano Roosevelt
Alfred Mossman Landon
Various candidates
Margin
Total votes cast[ 6]
#
%
#
%
#
%
#
%
Allegany
19,721
63.20%
11,191
35.87%
291
0.93%
8,530
27.34%
31,203
Anne Arundel
11,413
56.97%
8,478
42.32%
142
0.71%
2,935
14.65%
20,033
Baltimore
28,367
59.62%
18,893
39.71%
316
0.66%
9,474
19.91%
47,576
Baltimore City
210,668
67.89%
97,667
31.48%
1,959
0.63%
113,001
36.42%
310,294
Calvert
1,872
47.05%
2,082
52.32%
25
0.63%
-210
-5.28%
3,979
Caroline
3,579
57.67%
2,611
42.07%
16
0.26%
968
15.60%
6,206
Carroll
6,496
46.54%
7,383
52.90%
78
0.56%
-887
-6.36%
13,957
Cecil
4,914
57.26%
3,617
42.15%
51
0.59%
1,297
15.11%
8,582
Charles
2,597
49.15%
2,623
49.64%
64
1.21%
-26
-0.49%
5,284
Dorchester
5,293
58.56%
3,735
41.32%
11
0.12%
1,558
17.24%
9,039
Frederick
10,722
52.85%
9,500
46.83%
64
0.32%
1,222
6.02%
20,286
Garrett
3,252
44.11%
4,057
55.03%
64
0.87%
-805
-10.92%
7,373
Harford
6,165
53.46%
5,327
46.20%
39
0.34%
838
7.27%
11,531
Howard
4,138
60.63%
2,638
38.65%
49
0.72%
1,500
21.98%
6,825
Kent
2,931
53.22%
2,543
46.18%
33
0.60%
388
7.05%
5,507
Montgomery
13,246
56.29%
10,133
43.06%
153
0.65%
3,113
13.23%
23,532
Prince George's
15,087
64.76%
8,107
34.80%
101
0.43%
6,980
29.96%
23,295
Queen Anne's
3,548
64.47%
1,946
35.36%
9
0.16%
1,602
29.11%
5,503
Somerset
4,116
45.95%
4,770
53.25%
72
0.80%
-654
-7.30%
8,958
St. Mary's
2,829
54.00%
2,286
43.63%
124
2.37%
543
10.36%
5,239
Talbot
3,768
51.16%
3,578
48.58%
19
0.26%
190
2.58%
7,365
Washington
14,050
56.84%
10,619
42.96%
49
0.20%
3,431
13.88%
24,718
Wicomico
7,273
61.05%
4,545
38.15%
95
0.80%
2,728
22.90%
11,913
Worcester
3,567
53.25%
3,106
46.37%
25
0.37%
461
6.88%
6,698
Totals
389,612
62.35%
231,435
37.04%
3,849
0.62%
158,177
25.31%
624,896
Counties that flipped from Democratic to Republican
See also
References


