1944 United States presidential election in Michigan
1944 United States presidential election in Michigan
County Results
Roosevelt
50-60%
60-70%
Dewey
50-60%
60-70%
70-80%
80-90%
The 1944 United States presidential election in Michigan took place on November 7, 1944, as part of the 1944 United States presidential election . Voters chose 19[ 1] Electoral College , who voted for president and vice president .
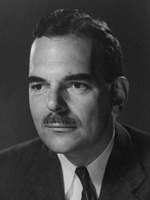
Michigan voted narrowly for Democratic nominee, incumbent Franklin D. Roosevelt over Republican Governor of New York Thomas E. Dewey , carrying 50.19% of the vote to Dewey's 49.18%.[ 2] [ 3] Detroit , Flint and most of the Upper Peninsula going to Roosevelt and most of the rest of the state going to Dewey. Michigan would not vote Democratic again until John F. Kennedy narrowly won the state in 1960 . This was the only state Roosevelt flipped from the previous election. Michigan was also one of six states that became more Democratic compared to 1940, alongside Illinois, Minnesota, New York, North Dakota, and Rhode Island.
Results
Results by county
County
Franklin Delano Roosevelt
Thomas Edmund Dewey
Claude A. Watson
Norman Mattoon Thomas
Various candidates
Margin
Total votes cast[ 4]
#
%
#
%
#
%
#
%
#
%
#
%
Alcona
716
32.11%
1,503
67.40%
5
0.22%
2
0.09%
4
0.18%
-787
-35.29%
2,230
Alger
2,519
62.41%
1,504
37.26%
8
0.20%
2
0.05%
3
0.07%
1,015
25.15%
4,036
Allegan
4,480
26.54%
12,327
73.04%
46
0.27%
18
0.11%
7
0.04%
-7,847
-46.49%
16,878
Alpena
2,856
38.98%
4,453
60.78%
13
0.18%
4
0.05%
1
0.01%
-1,597
-21.80%
7,327
Antrim
1,206
31.07%
2,626
67.66%
42
1.08%
2
0.05%
5
0.13%
-1,420
-36.59%
3,881
Arenac
1,280
39.13%
1,978
60.47%
7
0.21%
2
0.06%
4
0.12%
-698
-21.34%
3,271
Baraga
1,874
50.46%
1,829
49.25%
3
0.08%
7
0.19%
1
0.03%
45
1.21%
3,714
Barry
3,010
29.50%
7,057
69.17%
123
1.21%
6
0.06%
7
0.07%
-4,047
-39.66%
10,203
Bay
15,602
50.00%
15,459
49.54%
17
0.05%
78
0.25%
48
0.15%
143
0.46%
31,204
Benzie
1,084
34.50%
2,026
64.48%
19
0.60%
11
0.35%
2
0.06%
-942
-29.98%
3,142
Berrien
15,886
38.81%
24,832
60.66%
79
0.19%
101
0.25%
36
0.09%
-8,946
-21.85%
40,934
Branch
3,406
32.10%
7,155
67.44%
36
0.34%
11
0.10%
1
0.01%
-3,749
-35.34%
10,609
Calhoun
16,611
44.07%
20,664
54.82%
303
0.80%
99
0.26%
16
0.04%
-4,053
-10.75%
37,693
Cass
3,417
34.00%
6,566
65.33%
32
0.32%
20
0.20%
16
0.16%
-3,149
-31.33%
10,051
Charlevoix
1,893
38.06%
3,039
61.10%
28
0.56%
9
0.18%
5
0.10%
-1,146
-23.04%
4,974
Cheboygan
2,141
41.83%
2,943
57.50%
24
0.47%
4
0.08%
6
0.12%
-802
-15.67%
5,118
Chippewa
4,344
44.67%
5,335
54.86%
32
0.33%
6
0.06%
8
0.08%
-991
-10.19%
9,725
Clare
1,078
28.86%
2,636
70.58%
11
0.29%
6
0.16%
4
0.11%
-1,558
-41.71%
3,735
Clinton
2,533
23.06%
8,422
76.68%
20
0.18%
5
0.05%
4
0.04%
-5,889
-53.61%
10,984
Crawford
550
40.59%
797
58.82%
3
0.22%
4
0.30%
1
0.07%
-247
-18.23%
1,355
Delta
7,375
58.33%
5,213
41.23%
16
0.13%
27
0.21%
13
0.10%
2,162
17.10%
12,644
Dickinson
6,740
56.92%
4,987
42.11%
44
0.37%
44
0.37%
27
0.23%
1,753
14.80%
11,842
Eaton
5,049
33.35%
9,975
65.89%
85
0.56%
29
0.19%
2
0.01%
-4,926
-32.54%
15,140
Emmet
2,206
38.15%
3,538
61.19%
22
0.38%
14
0.24%
2
0.03%
-1,332
-23.04%
5,782
Genesee
52,445
55.72%
41,145
43.72%
218
0.23%
241
0.26%
68
0.07%
11,300
12.01%
94,117
Gladwin
985
28.44%
2,457
70.93%
12
0.35%
1
0.03%
9
0.26%
-1,472
-42.49%
3,464
Gogebic
7,938
59.83%
5,283
39.82%
14
0.11%
24
0.18%
9
0.07%
2,655
20.01%
13,268
Grand Traverse
2,607
32.28%
5,413
67.03%
37
0.46%
10
0.12%
8
0.10%
-2,806
-34.75%
8,075
Gratiot
3,160
28.10%
7,987
71.03%
87
0.77%
7
0.06%
3
0.03%
-4,827
-42.93%
11,244
Hillsdale
3,153
25.03%
9,364
74.33%
62
0.49%
16
0.13%
3
0.02%
-6,211
-49.30%
12,598
Houghton
10,066
52.32%
9,110
47.35%
29
0.15%
17
0.09%
16
0.08%
956
4.97%
19,238
Huron
2,301
19.34%
9,538
80.16%
21
0.18%
21
0.18%
17
0.14%
-7,237
-60.83%
11,898
Ingham
23,655
40.57%
34,255
58.74%
226
0.39%
137
0.23%
40
0.07%
-10,600
-18.18%
58,313
Ionia
4,437
31.89%
9,331
67.06%
120
0.86%
18
0.13%
8
0.06%
-4,894
-35.17%
13,914
Iosco
1,127
32.39%
2,340
67.26%
5
0.14%
4
0.11%
3
0.09%
-1,213
-34.87%
3,479
Iron
4,537
53.09%
3,945
46.16%
32
0.37%
23
0.27%
9
0.11%
592
6.93%
8,546
Isabella
2,522
28.18%
6,356
71.02%
52
0.58%
12
0.13%
7
0.08%
-3,834
-42.84%
8,949
Jackson
13,859
37.36%
22,992
61.97%
182
0.49%
41
0.11%
26
0.07%
-9,133
-24.62%
37,100
Kalamazoo
16,223
38.95%
24,974
59.96%
274
0.66%
137
0.33%
46
0.11%
-8,751
-21.01%
41,654
Kalkaska
409
28.97%
992
70.25%
10
0.71%
1
0.07%
0
0.00%
-583
-41.29%
1,412
Kent
43,679
44.07%
54,163
54.65%
1,121
1.13%
110
0.11%
43
0.04%
-10,484
-10.58%
99,116
Keweenaw
965
52.53%
866
47.14%
2
0.11%
2
0.11%
2
0.11%
99
5.39%
1,837
Lake
794
40.80%
1,145
58.84%
4
0.21%
2
0.10%
1
0.05%
-351
-18.04%
1,946
Lapeer
3,002
27.74%
7,769
71.80%
28
0.26%
11
0.10%
11
0.10%
-4,767
-44.05%
10,821
Leelanau
944
31.23%
2,063
68.24%
4
0.13%
10
0.33%
2
0.07%
-1,119
-37.02%
3,023
Lenawee
6,750
29.04%
16,382
70.48%
69
0.30%
18
0.08%
24
0.10%
-9,632
-41.44%
23,243
Livingston
2,910
28.01%
7,417
71.38%
44
0.42%
9
0.09%
11
0.11%
-4,507
-43.37%
10,391
Luce
790
39.64%
1,195
59.96%
4
0.20%
3
0.15%
1
0.05%
-405
-20.32%
1,993
Mackinac
1,488
39.41%
2,268
60.06%
10
0.26%
5
0.13%
5
0.13%
-780
-20.66%
3,776
Macomb
23,506
52.08%
21,305
47.20%
106
0.23%
115
0.25%
103
0.23%
2,201
4.88%
45,135
Manistee
3,398
45.13%
4,095
54.38%
12
0.16%
20
0.27%
5
0.07%
-697
-9.26%
7,530
Marquette
11,707
58.70%
8,163
40.93%
27
0.14%
26
0.13%
21
0.11%
3,544
17.77%
19,944
Mason
3,137
41.11%
4,446
58.27%
25
0.33%
14
0.18%
8
0.10%
-1,309
-17.16%
7,630
Mecosta
1,708
28.49%
4,217
70.34%
48
0.80%
8
0.13%
14
0.23%
-2,509
-41.85%
5,995
Menominee
4,632
48.39%
4,869
50.86%
39
0.41%
24
0.25%
9
0.09%
-237
-2.48%
9,573
Midland
3,569
34.05%
6,850
65.35%
28
0.27%
21
0.20%
14
0.13%
-3,281
-31.30%
10,482
Missaukee
759
27.47%
1,979
71.63%
24
0.87%
1
0.04%
0
0.00%
-1,220
-44.15%
2,763
Monroe
10,275
43.11%
13,478
56.54%
26
0.11%
31
0.13%
26
0.11%
-3,203
-13.44%
23,836
Montcalm
3,168
29.36%
7,525
69.74%
67
0.62%
25
0.23%
5
0.05%
-4,357
-40.38%
10,790
Montmorency
541
34.11%
1,034
65.20%
4
0.25%
5
0.32%
2
0.13%
-493
-31.08%
1,586
Muskegon
19,963
54.27%
16,536
44.95%
175
0.48%
67
0.18%
45
0.12%
3,427
9.32%
36,786
Newaygo
2,156
29.00%
5,250
70.62%
20
0.27%
4
0.05%
4
0.05%
-3,094
-41.62%
7,434
Oakland
55,272
47.73%
59,627
51.49%
292
0.25%
333
0.29%
289
0.25%
-4,355
-3.76%
115,813
Oceana
1,738
32.58%
3,534
66.24%
50
0.94%
8
0.15%
5
0.09%
-1,796
-33.66%
5,335
Ogemaw
1,006
29.91%
2,339
69.55%
4
0.12%
10
0.30%
4
0.12%
-1,333
-39.64%
3,363
Ontonagon
2,611
51.59%
2,433
48.07%
6
0.12%
5
0.10%
6
0.12%
178
3.52%
5,061
Osceola
1,338
25.84%
3,787
73.14%
43
0.83%
5
0.10%
5
0.10%
-2,449
-47.30%
5,178
Oscoda
332
34.95%
615
64.74%
1
0.11%
1
0.11%
1
0.11%
-283
-29.79%
950
Otsego
912
41.80%
1,259
57.70%
7
0.32%
3
0.14%
1
0.05%
-347
-15.90%
2,182
Ottawa
8,511
33.01%
17,077
66.23%
113
0.44%
65
0.25%
20
0.08%
-8,566
-33.22%
25,786
Presque Isle
2,092
48.49%
2,209
51.21%
3
0.07%
4
0.09%
6
0.14%
-117
-2.71%
4,314
Roscommon
484
27.05%
1,292
72.22%
6
0.34%
5
0.28%
2
0.11%
-808
-45.16%
1,789
Saginaw
20,383
42.11%
27,289
56.38%
590
1.22%
86
0.18%
54
0.11%
-6,906
-14.27%
48,402
Sanilac
2,015
17.39%
9,512
82.09%
34
0.29%
13
0.11%
13
0.11%
-7,497
-64.70%
11,587
Schoolcraft
1,724
50.01%
1,704
49.43%
11
0.32%
7
0.20%
1
0.03%
20
0.58%
3,447
Shiawassee
5,292
31.21%
11,601
68.41%
32
0.19%
26
0.15%
6
0.04%
-6,309
-37.21%
16,957
St. Clair
11,813
37.96%
19,175
61.61%
77
0.25%
38
0.12%
20
0.06%
-7,362
-23.65%
31,123
St. Joseph
4,235
30.06%
9,785
69.45%
43
0.31%
20
0.14%
6
0.04%
-5,550
-39.39%
14,089
Tuscola
2,938
22.98%
9,789
76.55%
41
0.32%
12
0.09%
7
0.05%
-6,851
-53.58%
12,787
Van Buren
5,002
31.19%
10,951
68.29%
38
0.24%
33
0.21%
13
0.08%
-5,949
-37.10%
16,037
Washtenaw
14,922
37.39%
24,740
62.00%
93
0.23%
118
0.30%
33
0.08%
-9,818
-24.60%
39,906
Wayne
554,670
63.38%
316,270
36.14%
650
0.07%
2,051
0.23%
1,452
0.17%
238,400
27.24%
875,093
Wexford
2,489
37.39%
4,074
61.21%
83
1.25%
9
0.14%
1
0.02%
-1,585
-23.81%
6,656
Totals
1,106,899
50.19%
1,084,423
49.18%
6,503
0.29%
4,598
0.21%
2,800
0.13%
22,476
1.02%
2,205,223
Counties that flipped from Republican to Democratic
Counties that flipped from Democratic to Republican
See also
References


