Share to:


Baraga County, Michigan

Baraga County
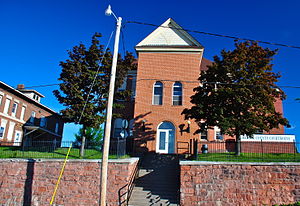
Baraga County Courthouse and Annex (July 2014)
Flag of Baraga County
Official seal of Baraga County
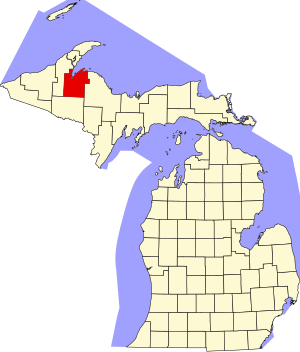
Map of Michigan highlighting Baraga County
Location within the U.S. state of Michigan
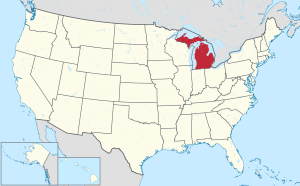
Map of the United States highlighting Michigan
Michigan's location within the U.S.
Coordinates: 46°43′N 88°20′W / 46.72°N 88.34°W / 46.72; -88.34
Country United States
State Michigan
FoundedFebruary 19, 1875[1][2]
Named forFrederic Baraga
SeatL'Anse
Largest villageBaraga
Area
 • Total
1,069 sq mi (2,770 km2)
 • Land898 sq mi (2,330 km2)
 • Water171 sq mi (440 km2)  16%
Population
 (2020)
 • Total
8,158
 • Density9.9/sq mi (3.8/km2)
Time zoneUTC−5 (Eastern)
 • Summer (DST)UTC−4 (EDT)
Congressional district1st
Websitekeweenawbay.org

Baraga County (/ˈbɛərəɡə/ BAIR-ə-gə) is a county in the Upper Peninsula in the U.S. state of Michigan. As of the 2020 census, the population was 8,158, making it Michigan's fifth-least populous county.[3] The county seat is L'Anse.[4] The county is named after Bishop Frederic Baraga, a Catholic missionary who ministered to the Ojibwa Indians in the Michigan Territory.[1]

The L'Anse Indian Reservation of the Ojibwa is within Baraga County.

Geography

Entrance sign for Baraga County on U.S. Route 141

According to the U.S. Census Bureau, the county has a total area of 1,069 square miles (2,770 km2), of which 898 square miles (2,330 km2) is land and 171 square miles (440 km2) (16%) is water.[5]

The county is located in the state's Upper Peninsula on the shore of Lake Superior, at the southeast base of the Keweenaw Peninsula. The villages of Baraga and L'Anse are located at the base of Lake Superior's Keweenaw Bay. Point Abbaye projects north into the lake, enclosing Huron Bay. The eastern two-thirds of the county includes much of the Huron Mountains, including Mount Arvon—the highest natural point in Michigan at 1,979 feet (603 m).

Major highways

  • US 41: runs north–south through the upper central part of county. The highway enters at the northeast corner of the county on the west shore of Keweenaw Bay and runs south along the shoreline to Baraga and L'Anse, then turns inland (south) past Alberta, then east through Nestoria and Three Lakes. It exits into Marquette County at Imperial Heights.
  • US 141: runs south from its intersection with US-41 south of Alberta into Iron County.
  • M-28: enters the west side of the county then runs east and east-northeast to the intersection with US-141 at Covington.
  • M-38: runs east–west through the northwest corner of county. It enters from Alston in Houghton County, then runs east to intersection with US-41 at Baraga.

Adjacent counties

National protected areas

Communities

U.S. Census data map showing local municipal boundaries within Baraga County.

Villages

Civil townships

Census-designated places

Other unincorporated communities

Indian reservations

Demographics

Historical population
CensusPop.Note
18801,804
18903,03668.3%
19004,32042.3%
19106,12741.8%
19207,66225.1%
19309,16819.7%
19409,3562.1%
19508,037−14.1%
19607,151−11.0%
19707,7898.9%
19808,4848.9%
19907,954−6.2%
20008,74610.0%
20108,8601.3%
20208,158−7.9%
2023 (est.)8,310[6]1.9%
US Decennial Census[7]
1790–1960[8] 1900–1990[9]
1990–2000[10] 2010–2018[3]

The 2010 United States census indicated Baraga County had a population of 8,860.[11] This was an increase of 114 people from 2000. In 2010 there were 3,444 households and 2,209 families in the county. The population density was 10 people per square mile (3.9 people/km2). There were 5,270 housing units at an average density of 6 per square mile (2.3/km2). Among the county, 75.0% of the population was White, 13.1% Native American, 7.2% Black or African American, 0.1% Asian, 0.2% of some other race and 4.4% of two or more races; 1.0% were Hispanic or Latino (of any race). Additionally, 22.5% were of Finnish, 9.1% German, 8.8% French, French Canadian or Cajun, 5.6% English and 5.5% Irish ancestry.[12] By the 2020 census, its population was 8,158.[3]

In 2010, there were 3,444 households, out of which 25.2% had children under the age of 18 living with them, 47.4% were married couples living together, 10.9% had a female householder with no husband present, and 35.9% were non-families. Of all households, 31.6% were made up of individuals, and 13% had someone living alone who was 65 years of age or older. The average household size was 2.28 and the average family size was 2.82. The age distribution of the county population was the following: 20.2% were under the age of 18, 7% from 18 to 24, 25.7% from 25 to 44, 29.7% from 45 to 64, and 17.2% who were 65 years of age or older. The median age was 42.9 years; 54.9% of the population was male, 45.1% was female.

As of 2010, the median income for a household in the county was $40,115, and the median income for a family was $50,996. The per capita income for the county was $19,076. About 9.5% of families and 13% of the population were below the poverty line, including 19.2% of those under age 18 and 6.7% of those age 65 or over. By the 2021 census estimates, its median household income was $45,792.[3]

Government

Baraga County has tended to support Republican candidates. Since 1884 its voters have selected the Republican Party nominee in 67% (24 of 36) of the national elections through 2024, and in all presidential elections since 2000.

United States presidential election results for Baraga County, Michigan[13]
Year Republican Democratic Third party(ies)
No.  % No.  % No.  %
2024 2,779 64.09% 1,488 34.32% 69 1.59%
2020 2,512 62.07% 1,478 36.52% 57 1.41%
2016 2,158 61.34% 1,156 32.86% 204 5.80%
2012 1,866 53.47% 1,574 45.10% 50 1.43%
2008 1,846 50.53% 1,725 47.22% 82 2.24%
2004 1,977 53.66% 1,660 45.06% 47 1.28%
2000 1,836 54.11% 1,400 41.26% 157 4.63%
1996 1,209 36.70% 1,601 48.60% 484 14.69%
1992 1,160 31.96% 1,695 46.69% 775 21.35%
1988 1,630 47.88% 1,753 51.50% 21 0.62%
1984 1,965 51.82% 1,818 47.94% 9 0.24%
1980 2,046 52.18% 1,609 41.04% 266 6.78%
1976 1,788 49.47% 1,778 49.20% 48 1.33%
1972 1,905 54.93% 1,517 43.74% 46 1.33%
1968 1,508 45.45% 1,680 50.63% 130 3.92%
1964 1,160 31.05% 2,568 68.74% 8 0.21%
1960 1,861 48.51% 1,964 51.20% 11 0.29%
1956 1,968 55.51% 1,574 44.40% 3 0.08%
1952 2,103 57.29% 1,540 41.95% 28 0.76%
1948 1,878 50.11% 1,656 44.18% 214 5.71%
1944 1,829 49.25% 1,874 50.46% 11 0.30%
1940 2,512 53.48% 2,152 45.82% 33 0.70%
1936 2,035 46.94% 2,218 51.16% 82 1.89%
1932 1,917 46.92% 2,016 49.34% 153 3.74%
1928 2,203 65.27% 1,046 30.99% 126 3.73%
1924 1,714 71.84% 208 8.72% 464 19.45%
1920 1,368 74.67% 304 16.59% 160 8.73%
1916 748 57.19% 462 35.32% 98 7.49%
1912 295 25.97% 280 24.65% 561 49.38%
1908 765 73.98% 232 22.44% 37 3.58%
1904 564 73.34% 185 24.06% 20 2.60%
1900 606 63.92% 333 35.13% 9 0.95%
1896 611 55.90% 459 41.99% 23 2.10%
1892 375 36.76% 630 61.76% 15 1.47%
1888 389 48.69% 406 50.81% 4 0.50%
1884 396 56.33% 307 43.67% 0 0.00%

Baraga County operates the county jail, maintains rural roads, operates the major local courts, records deeds, mortgages, and vital records, administers public health regulations, and participates with the state in the provision of social services. The county board of commissioners controls the budget and has limited authority to make laws or ordinances. In Michigan, most local government functions – police and fire, building and zoning, tax assessment, street maintenance etc. – are the responsibility of individual cities and townships.

See also

References

  1. ^ a b "Bibliography on Baraga County". Clarke Historical Library, Central Michigan University. Retrieved January 19, 2013.
  2. ^ "jengod.com".
  3. ^ a b c d "State & County QuickFacts". US Census Bureau. Retrieved September 15, 2021.
  4. ^ "Find a County". National Association of Counties. Retrieved June 7, 2011.
  5. ^ "2010 Census Gazetteer Files". US Census Bureau. August 22, 2012. Retrieved September 19, 2014.
  6. ^ "Annual Estimates of the Resident Population for Counties: April 1, 2020 to July 1, 2023". United States Census Bureau. Retrieved April 4, 2024.
  7. ^ "US Decennial Census". US Census Bureau. Retrieved September 19, 2014.
  8. ^ "Historical Census Browser". University of Virginia Library. Retrieved September 19, 2014.
  9. ^ "Population of Counties by Decennial Census: 1900 to 1990". US Census Bureau. Retrieved September 19, 2014.
  10. ^ "Census 2000 PHC-T-4. Ranking Tables for Counties: 1990 and 2000" (PDF). US Census Bureau. Archived (PDF) from the original on March 27, 2010. Retrieved September 19, 2014.
  11. ^ "U.S. Census website". Retrieved July 6, 2013.
  12. ^ Data Access and Dissemination Systems (DADS). "U.S. Census website". census.gov.
  13. ^ US Election Atlas
Kembali kehalaman sebelumnya